Very bad experience. The crypto market closes for two full days while it is open on all platforms. Withdrawals and deposits are very slow. I will not repeat this experience with you again.
Safe-haven assets caught a strong bid in recent trading, directing Spot Gold to all-time highs of US$3,220/troy ounce versus the US dollar (XAU/USD). The shift towards safe-haven markets was fuelled by softer demand for the USD as markets fled dollar assets, as well as escalating trade tensions between the US and China. Unsurprisingly, the Swiss franc (CHF) and...
A long-term, double-top formation has emerged from the all-time highs of 45,073 on the weekly chart of the Dow Jones Industrial Average. With the pattern’s neckline breached (derived from the low of 41,844), chartists will likely target the structure’s profit objective, which stands at 38,613.
WTI shed nearly 10% last week and tested levels not seen since early 2021. As a result, the downside move punctured the lower boundary of a descending triangle formation on the weekly chart, extended from a high of US$95.01 and a low of US$64.34. Technically, this opens the door to possible bearish scenarios in the weeks to come toward a decision point zone at...
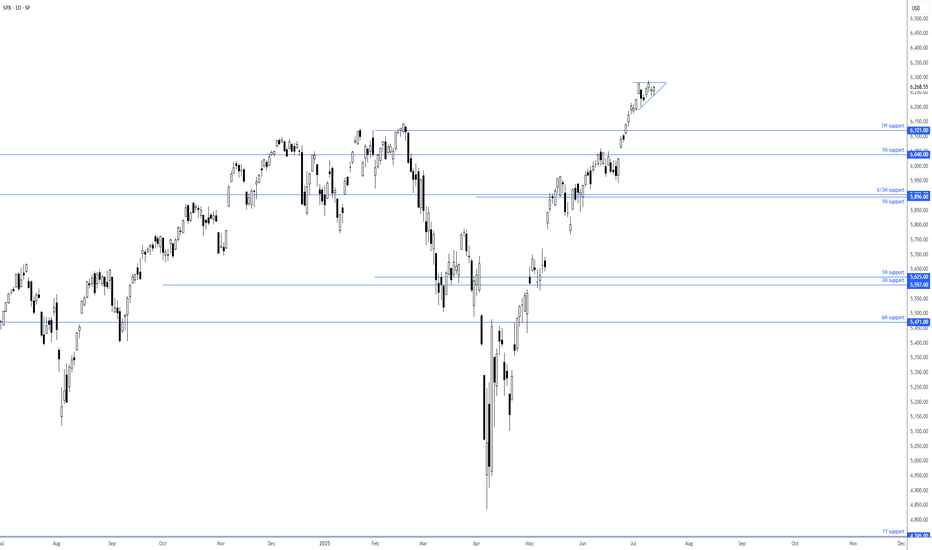
Unsurprisingly, the Cboe Volatility Index (VIX Index) – one of the most popular measures of US stock market volatility – recently shook hands with 30.00, levels not seen since August 2024. As a result, I am closely monitoring the daily charts of the VIX (with standard Bollinger Bands overlaid) and the S&P 500.
As shown on the charts, the VIX closed above the...
Following the pullback from lows of N$1.0903 on 20 March in the AUD/NZD cross (Australian dollar versus the New Zealand dollar) – a move that also completed a longer-term double-top pattern at N$1.1180 – buyers and sellers on the daily chart are squaring off at resistance from N$1.1002. Complementing this area is a trendline that has turned from support to...
With price action on the monthly timeframe rejecting the underside of the 50-month simple moving average (SMA) at US$1.0927 and daily price recently completing a double-top pattern from the lower edge of said SMA (breaching the neckline taken from the low of US$1.0823), EUR/USD (euro versus the US dollar) bears will likely remain on the offensive until the...