Market analysis from FP Markets
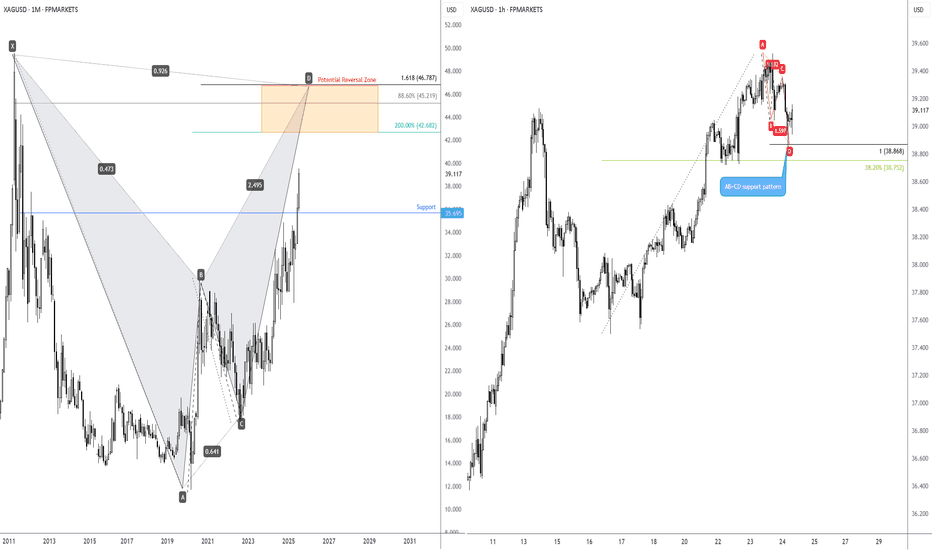
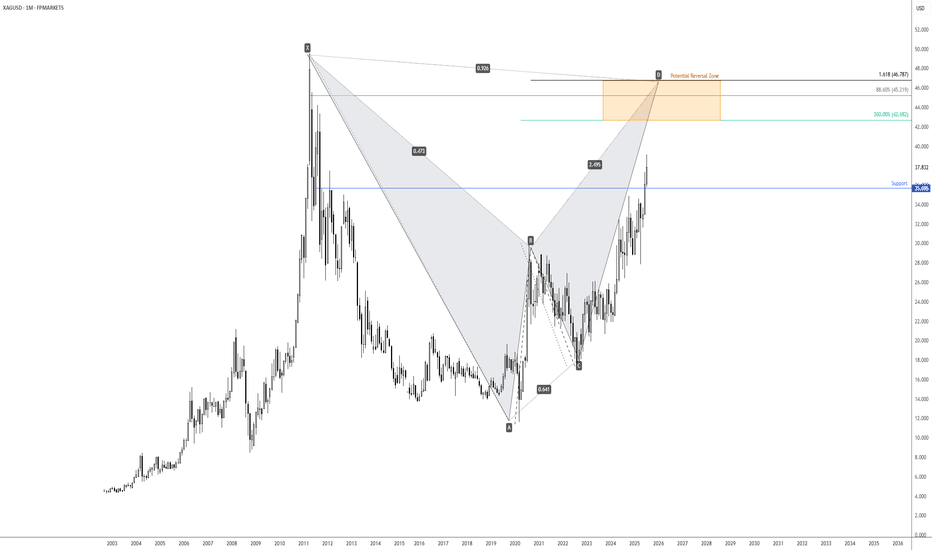
I touched on the longer-term price action of Spot Silver (XAG/USD) last week, showing that the unit is on track to shake hands with a Potential Reversal Zone (PRZ) of a monthly harmonic bat pattern between US$46.79 and US$42.68. Keeping things aligned with the harmonic landscape, you will note that H1 price action recently printed an AB=CD bullish pattern at...
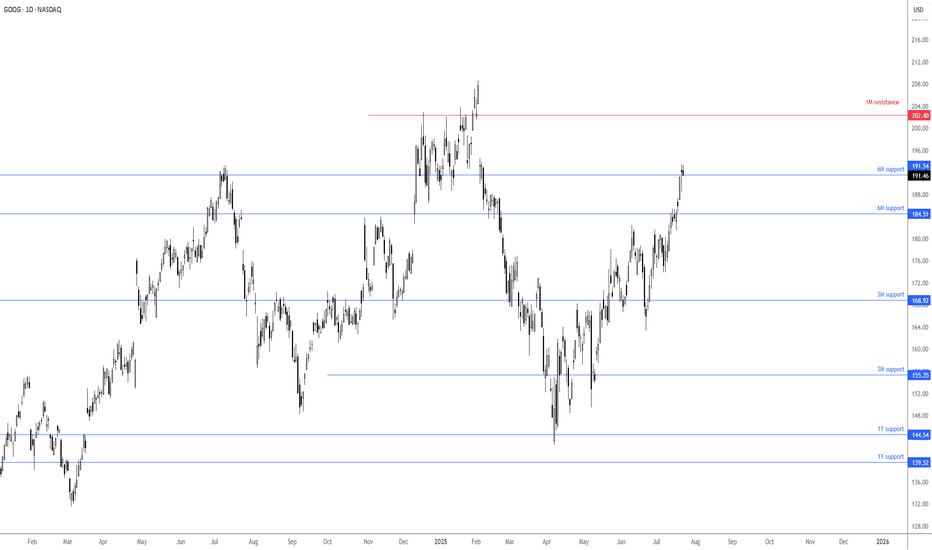
Ahead of today’s Q2 earnings release, you can see the price of Alphabet is trading just above a 6M support at US$191.54. Finding acceptance north of this support level could prompt buyers to change gears and potentially target a 1M resistance level at US$202.40. If price makes it above here, you will likely see the Stock challenge all-time highs of US$208.70,...
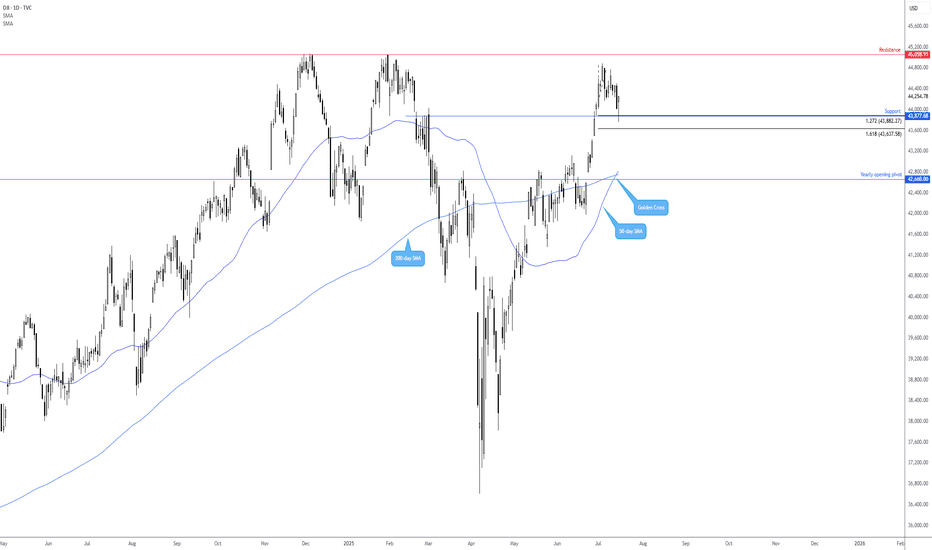
The Dow Jones Industrial Average (DOW) is clearly trending higher, pencilling in a series of higher highs and higher lows. Supporting this trend is the 50-day simple moving average (SMA) at 42,816 crossing above the 200-day SMA at 42,749; this is referred to as a ‘Golden Cross’ and suggests a longer-term uptrend may be on the table. This, coupled with the recent...
Longer-term price action on the price of Spot Silver (XAG/USD) is on track to shake hands with a Potential Reversal Zone (PRZ) of a monthly bat pattern between US$46.79 and US$42.68. What this also tells Silver traders is that according to this pattern’s structure, there is scope for additional outperformance. As a result, I am closely monitoring monthly support...
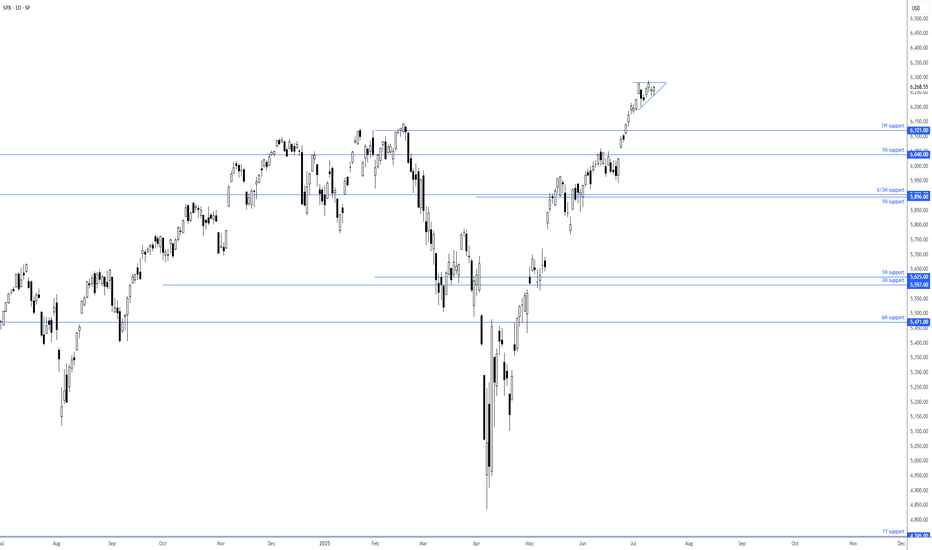
Of late, we have seen price action on the S&P 500 consolidate around all-time highs of 6,290 and is on track to form a small ascending triangle. The nearest support to note resides at the 1W level of 6,121, closely shadowed by a 1M support from 6,040. Based on the current technical picture, this clearly remains a buyers’ market. - FP Markets Research Team
As shown in the chart studies, premarket trading for the DAL stock indicates that price is trading 10% in the green, breaking through key resistances at the 3M level of US$51.80. Overhead, attention will now be on two barriers of resistance: the 1M level at US$57.51 and the 3M base at US$60.16. FP Markets Research Team
As shown on the daily chart of the USD Index, the currency has been biased to the downside for most of this year and recently met with 1M support at 96.80. This has caused the Index to modestly rebound and retest a 6M resistance at 97.39. Given this level's significance and trend direction, sellers could show from 97.39 and refresh year-to-date lows towards 1Y...
I intend to keep the following post concise and to the point. As exhibited on the daily timeframe of ETH/USD (Ethereum versus the US dollar), price recently shook hands with support from US$2,332. Not only does this base serve as a historically significant barrier, but it also coincides with the 50-day simple moving average at US$2,305 and a trendline support,...
Front page news this morning focussed on the ceasefire between Israel and Iran, first announced by US President Donald Trump on his Truth Social platform. However, reports recently emerged of Iran firing missiles, seemingly violating the ceasefire, but no confirmation has been received yet. The point is that things remain somewhat uncertain as of writing. The...
It is widely regarded as a ‘sealed deal’ that the US Federal Reserve (Fed) will maintain the current target rate at 4.25% - 4.50% today, marking a fourth consecutive meeting on hold. This is likely to displease US President Donald Trump, who has repeatedly called for rate cuts, recently referring to the Fed Chairman Jerome Powell as ‘stupid’. Despite Trump’s...
the European Central Bank (ECB) will be in focus today at 12:15 pm GMT and is anticipated to reduce rates amid recent CPI inflation (Consumer Price Index) softening by more-than-expected in May to 1.9% at the headline year-on-year (YY) level from 2.2% in April. YY core inflation – a measure that excludes volatile energy, food, alcohol, and tobacco prices – also...
C$1.3945 was made short work of in April and retested as resistance in May, following a fourth consecutive month in the red. Technically speaking, the scope to explore deeper water is evident on the monthly scale until C$1.3534, followed by another layer of support from C$1.3242. In view of this, as well as the lack of bullish intent evident from trendline...
There is no denying that Europe’s shared currency (EUR) is having a strong year against the US dollar (USD) so far, with the EUR/USD pair rising by almost 10%. Monthly support in play In one fell swoop, April’s price action made short work of the 50-month simple moving average (SMA) at US$1.0904 and the monthly resistance at US$1.1134. This prompted the unit...
Following the EUR/USD (euro versus the US dollar) trading within striking distance of a head and shoulders top pattern’s profit objective at US$1.1049, bulls went on the offensive. Consequently, price has pencilled in an AB=CD bearish formation at US$1.1332, according to the 100% projection ratio and a 1.618% Fibonacci extension ratio of US$1.1353 (B-C...
April retail sales data is scheduled to be released at 12:30 pm GMT tomorrow and will be a closely watched report as investors seek signs of any impact derived from tariffs, as well as potential future rate cuts by the US Federal Reserve (Fed). According to LSEG Data and Analytics, economists expect retail sales to have stagnated, following a 1.5% gain in March –...
Following the agreement between the United States (US) and China to temporarily reduce tariffs, there has been a notable unwinding of safe-haven assets and an increase in demand across risk. Recent developments show the US is preparing to lower levies from 145% to 30%, while China is set to decrease tariffs from 125% to 10%. Safe-haven assets weighed Along...
Monthly bullish outside candle Versus the US dollar (USD), Bitcoin (BTC) is poised to snap a two-month decline and pencil in a bullish outside candle on the monthly chart (textbook engulfing candles focus on the candle’s real bodies rather than upper/lower wicks). Additionally, it is important to observe that the Relative Strength Index (RSI) failed to break the...
Following a low of 4,835 on 7 April – which touched gloves with an ‘alternate’ AB=CD support (1.272% Fibonacci projection ratio) at 4,983 – the S&P 500 index is on course to pencil in an ‘equal’ AB=CD resistance (100% projection ratio) at 5,746. Notably, the 5,746 level is accommodated by a 1.618% Fibonacci projection ratio at 5,718, as well as a nearby 61.8%...
