Market analysis from FXOpen
Moderna (MRNA) Shares Plunge Nearly 9% Moderna (MRNA) shares tumbled by approximately 8.9%, falling below $29—marking their lowest level since April 2020, when global markets were shaken by the COVID-19 pandemic. Since the start of 2025, MRNA’s share price has declined by around 32%. Why Did MRNA Shares Drop? On Monday, MRNA led the decline among US biotech...
Brent Crude Oil Price Rises Above $71 Brent crude oil is trading above $71 per barrel today, marking its highest level since late February. As shown on the XBR/USD chart, the price surged by approximately 2.6% on the last day of March. Why Has Oil Risen? Bullish sentiment in the market is driven by the US President’s stance on Russia and Iran. According to...
What Is an Inverse Fair Value Gap (IFVG) Concept in Trading? Inverse Fair Value Gaps (IFVGs) are a fascinating concept for traders seeking to refine their understanding of price behaviour. By identifying areas where market sentiment shifts, IFVGs provide unique insights into potential reversals and key price levels. In this article, we’ll explore what IFVGs are,...
Market Analysis: NZD/USD Struggles to Sustain Gains—What’s Next? NZD/USD is also moving lower and might extend losses below 0.5700. Important Takeaways for NZD/USD Analysis Today - NZD/USD declined steadily from the 0.5760 resistance zone. - There is a major bearish trend line forming with resistance at 0.5715 on the hourly chart of NZD/USD at FXOpen. ...
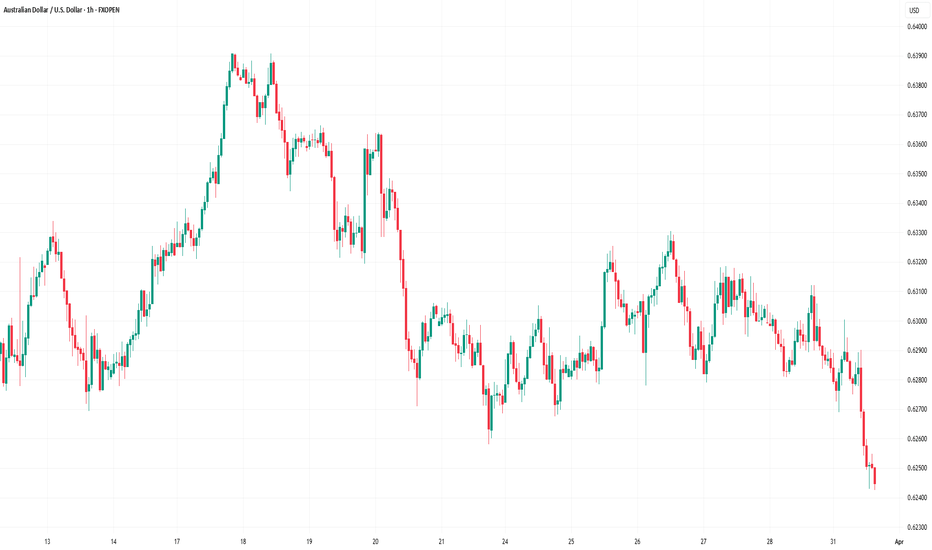
Market Analysis: AUD/USD Struggles to Sustain Gains—What’s Next? AUD/USD declined below the 0.6320 and 0.6300 support levels. Important Takeaways for AUD/USD Analysis Today - The Aussie Dollar started a fresh decline from well above the 0.6320 level against the US Dollar. - There is a connecting bearish trend line forming with resistance at 0.6300 on the...
Market Insights with Gary Thomson: RBA Rates, US and Canada’s Employment Data & Earnings Reports In this video, we’ll explore the key economic events, market trends, and corporate news shaping the financial landscape. Get ready for expert insights into forex, commodities, and stocks to help you navigate the week ahead. Let’s dive in! In this episode, we...
Alphabet (GOOGL) Stock Hits 2025 Low As seen on the Alphabet (GOOGL) stock chart, the price has dropped close to $156—a level not seen since September 2024. Since the start of 2025, the stock has fallen by more than 18%. Why Is GOOGL Falling? As mentioned earlier today, overall market sentiment remains bearish due to the White House’s tariff policies. For...
Stock Markets Decline Amid Trump Tariff News Comparing the approximate difference between last week's opening and closing prices on stock index charts: ➝ The US S&P 500 (US SPX 500 mini on FXOpen) fell by 2.4%. ➝ The European Euro Stoxx 50 (Europe 50 on FXOpen) dropped by 2%. Why Are Stocks Falling? The bearish sentiment in stock markets is largely driven by...
Ford (F) Share Price Drops Following Trump's Tariffs President Trump has fulfilled his promise to impose tariffs on foreign car manufacturers, introducing a 25% tariff on all cars and light trucks not made in the United States, as well as on "certain auto parts." As reported by Yahoo Finance: "This will continue to drive growth like you've never seen before,"...
Gold Price Hits Record High On 19 March, we reported that gold had surpassed $3,000 per ounce for the first time in history and suggested this psychological level could be tested. As shown on the XAU/USD chart, the price briefly dipped below $3,000 but quickly rebounded. According to the Smart Money Concept methodology, this may have been a liquidity sweep...
What Are the Inner Circle Trading Concepts? Inner Circle Trading (ICT) offers a sophisticated lens through which traders can view and interpret market movements, providing traders with insights that go beyond conventional technical analysis. This article explores key ICT concepts, aiming to equip traders with a thorough understanding of how these insights can...
XNG/USD Analysis: Natural Gas Price Drops to March Low On 27 January, our analysis of the natural gas chart highlighted the formation of an ascending channel. Later, on 10 March, we noted that the sharp price increase had created technical conditions for a correction. Since then, as indicated by the arrow on the XNG/USD chart, natural gas prices have declined...
Nvidia (NVDA) Share Price Continues Bearish Trend Earlier this month, our analysis of NVDA's share price led us to: → Establish a downward channel (marked in red). → Suggest that the lower boundary could act as support, which was confirmed (circled). On 13 March, we anticipated the median line of this channel might serve as resistance, and yesterday’s ~5%...
Is There the Best Time to Trade Forex in the UK? Grasping the nuances of forex market hours is essential for traders aiming to optimise their strategies. Operating continuously from Sunday evening to Friday night, the currency market accommodates participants across various time zones without being anchored to a singular physical location. For those in the UK,...
Boeing (BA) Share Price Rally Slows Near Key Resistance The Boeing (BA) stock chart shows that since its March low, the price has surged by approximately 25%, significantly outperforming the S&P 500 index (US SPX 500 mini on FXOpen). This rally was driven by the news that Boeing secured a contract to develop the next generation of fighter jets for the U.S....
UK Inflation Declines Today, the latest UK Consumer Price Index (CPI) figures were released. According to ForexFactory: The actual annual CPI came in at 2.8%, Analysts had expected it to remain at the previous level of 3.0%. As a result, the British pound weakened, and a slight spike in volatility was observed on the FTSE 100 stock index chart (UK 100 on...
What Is a Liquidity Sweep and How Can You Use It in Trading? Mastering key concepts such as liquidity is crucial for optimising trading strategies. This article explores the concept of a liquidity sweep, a pivotal phenomenon within trading that involves large-scale players impacting price movements by triggering clustered pending orders, and how traders can...
Market Analysis: USD/JPY Eyes Fresh Surge USD/JPY is rising and might gain pace above the 151.00 resistance. Important Takeaways for USD/JPY Analysis Today - USD/JPY climbed higher above the 149.55 and 150.00 levels. - There is a connecting bullish trend line forming with support at 150.30 on the hourly chart at FXOpen. USD/JPY Technical Analysis On the...


