Market analysis from FXOpen
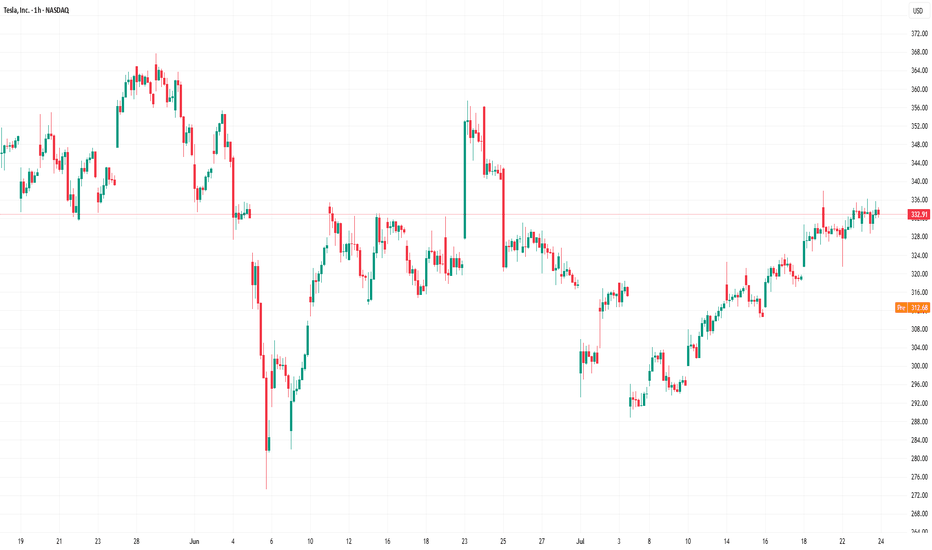
Tesla Shares (TSLA) Drop Following Earnings Report Yesterday, after the close of the main trading session on the stock market, Tesla released its quarterly earnings report. While both earnings per share (EPS) and gross profit slightly exceeded analysts’ expectations, the results reflected a negative trend driven by declining sales. This decline is being...
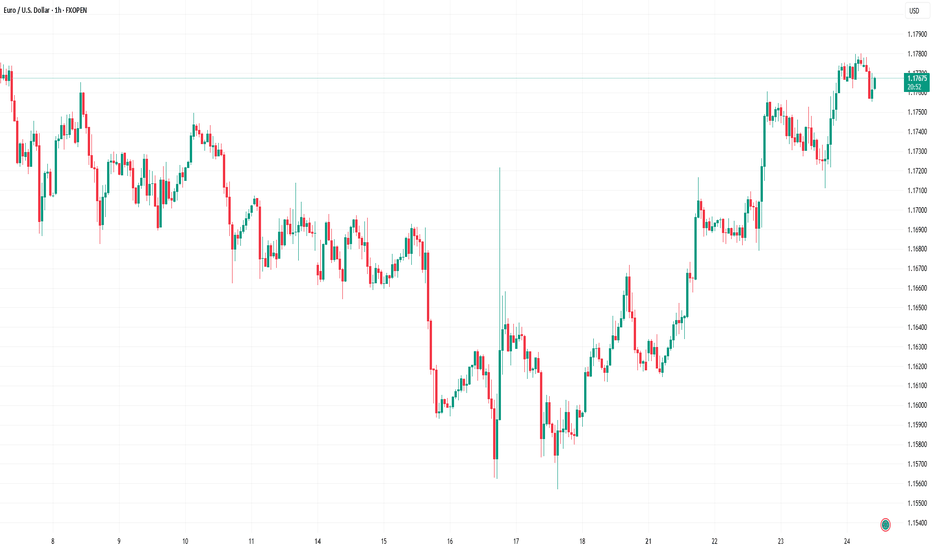
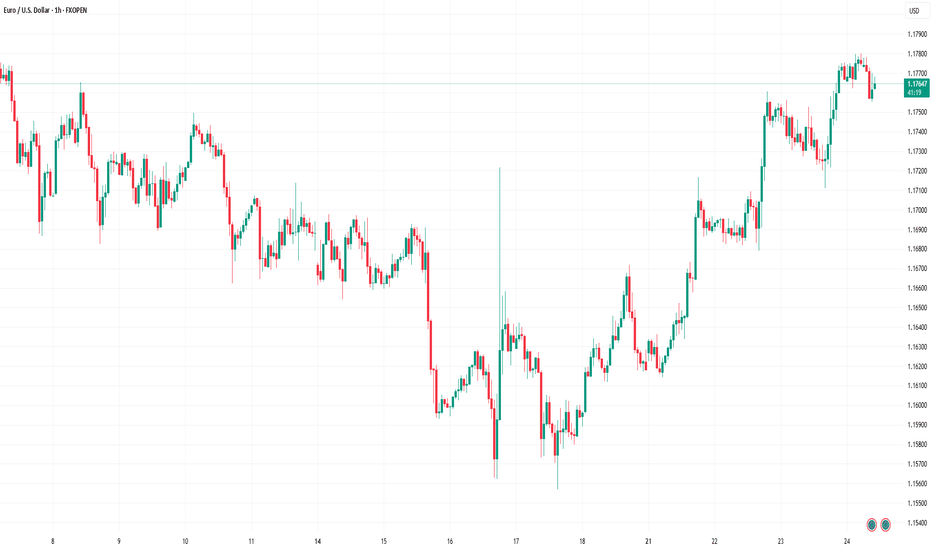
EUR/USD Rises to 2.5-Week High Ahead of ECB Meeting Today at 15:15 GMT+3, the European Central Bank (ECB) will announce its interest rate decision, followed by a press conference at 15:45 GMT+3. According to Forex Factory, the main refinancing rate is expected to remain unchanged at 2.15% after seven consecutive cuts. In anticipation of these events, the...
Trading Divergences With Wedges in Forex Divergence trading in forex is a powerful technique for analysing market movements, as is observing rising and falling wedges. This article explores the synergy between divergence trading and wedges in forex, offering insights into how traders can leverage these signals. From the basics to advanced strategies, learn how...
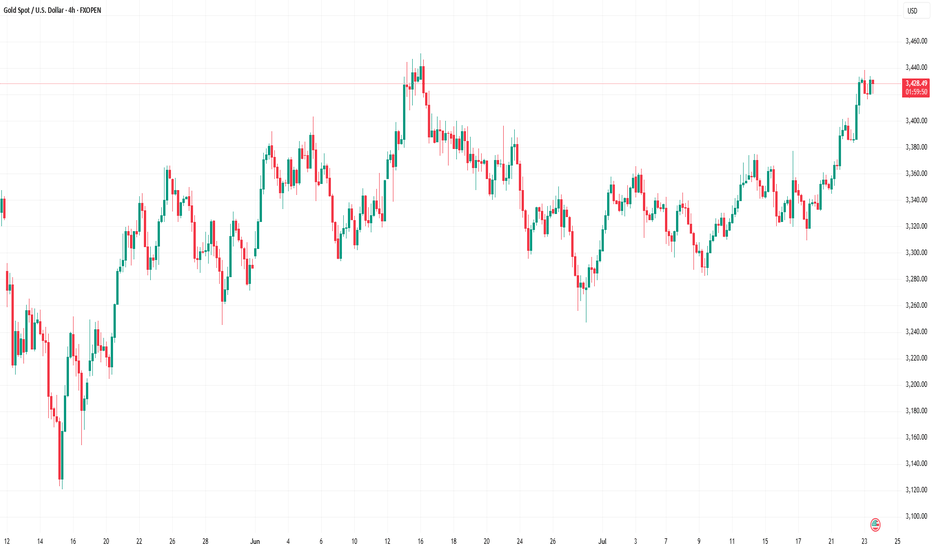
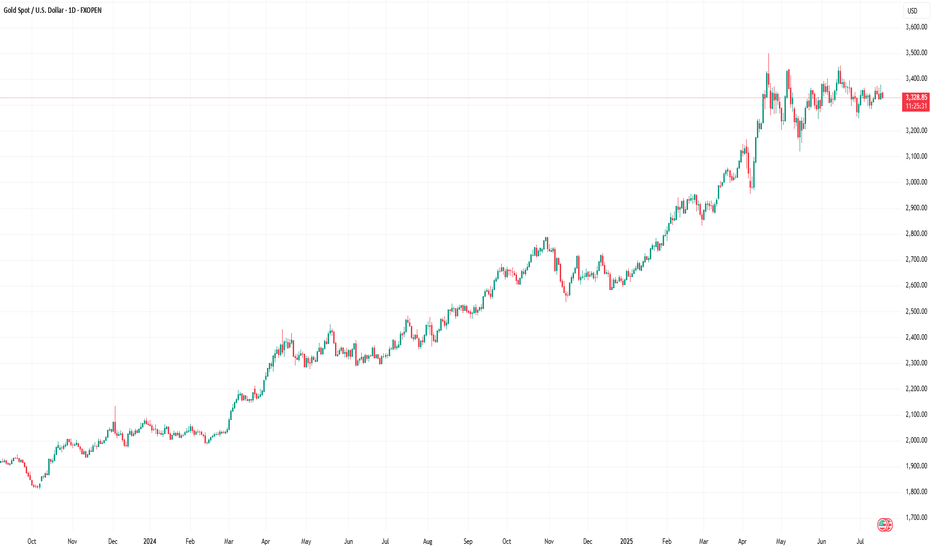
XAU/USD Chart Analysis: Bulls Break Important Resistance When analysing the XAU/USD chart last week, we: → noted that the ADX indicator had reached its lowest level since the beginning of 2025 – a clear sign of declining gold price volatility; → highlighted the formation of a large-scale triangle with its axis around the $3,333 level, bounded by a resistance...
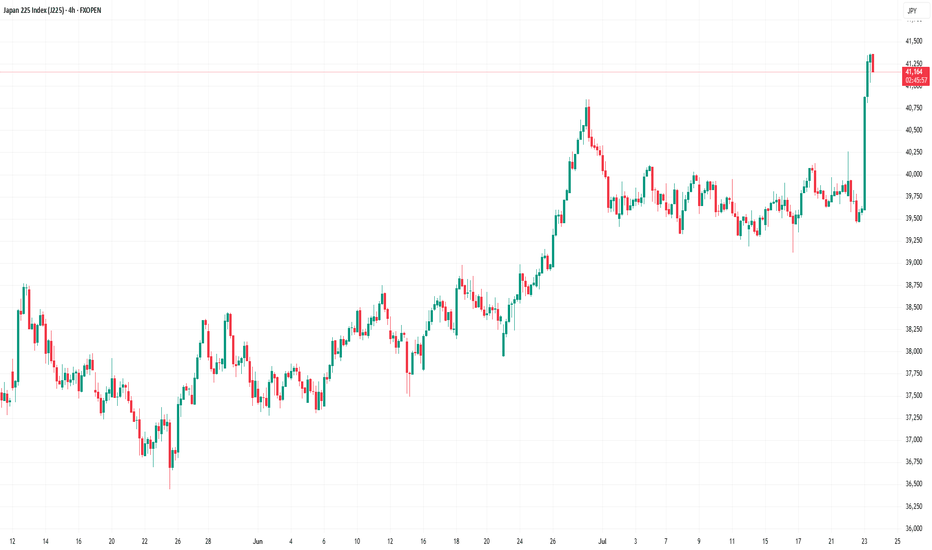
Nikkei 225 Index Surges Above 41,000 Points As the chart indicates, the value of the Nikkei 225 stock index has risen above the 41,000-point level — its highest mark since July 2024. The primary bullish driver is the conclusion of a trade agreement between the United States and Japan. According to media reports, the deal will involve Japan paying a 15% duty on...
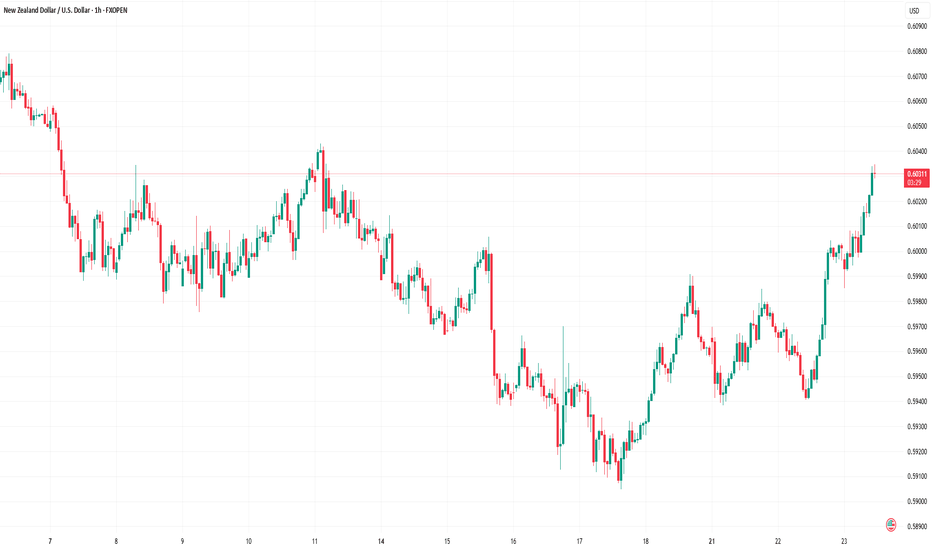
Market Analysis: NZD/USD Climbs as Dollar Weakens NZD/USD is also rising and might aim for more gains above 0.6000. Important Takeaways for NZD/USD Analysis Today - NZD/USD is consolidating gains above the 0.5980 zone. - There was a break above a major bearish trend line with resistance at 0.5980 on the hourly chart of NZD/USD. NZD/USD Technical Analysis...
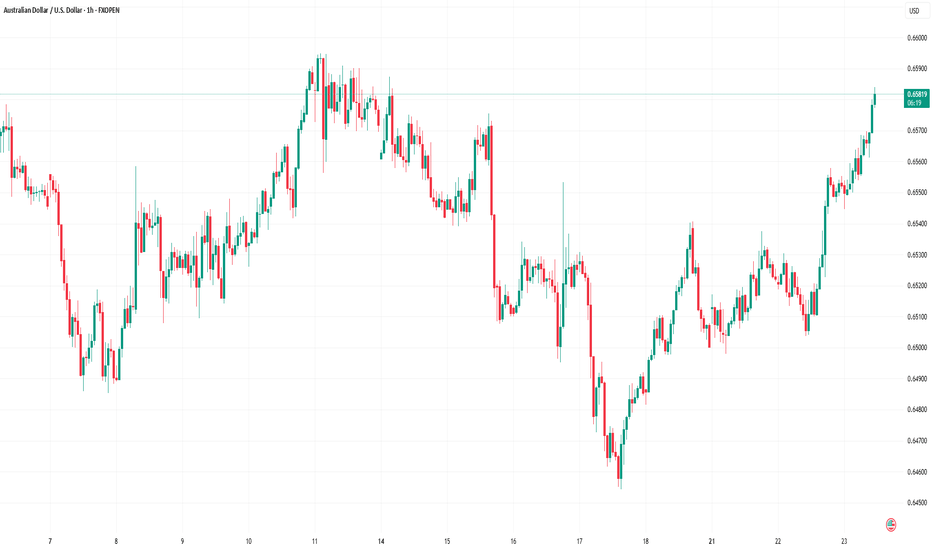
Market Analysis: AUD/USD Climbs as Dollar Weakens AUD/USD started a decent increase above the 0.6520 level. Important Takeaways for AUD/USD Analysis Today - The Aussie Dollar rebounded after forming a base above the 0.6450 level against the US Dollar. - There is a connecting bullish trend line forming with support at 0.6540 on the hourly chart of AUD/USD. ...
Gold CFD Trading: Practical Steps and Influencing Factors Gold trading in forex offers a dynamic and potentially rewarding opportunity for traders. This article delves into the essentials of trading gold, from understanding its unique position as both a commodity and a financial asset to its price determinants and how to trade it. Understanding Gold as a...
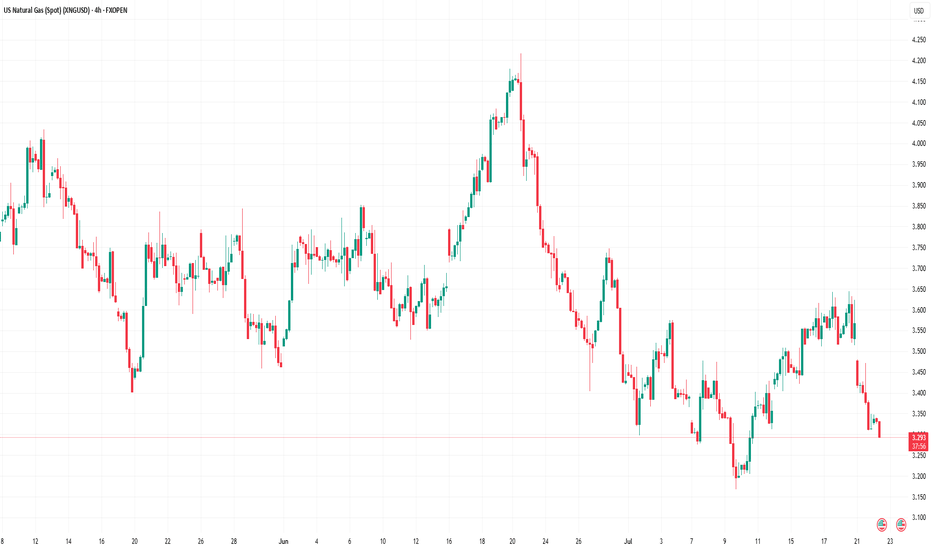
Natural Gas Price Drops by 7% As the XNG/USD chart shows today, natural gas is trading around $3.333/MMBtu, although yesterday morning the price was approximately 7% higher. According to Reuters, the decline in gas prices is driven by: → Record-high production levels. LSEG reported that average gas output in the Lower 48 rose to 107.2 billion cubic feet per...
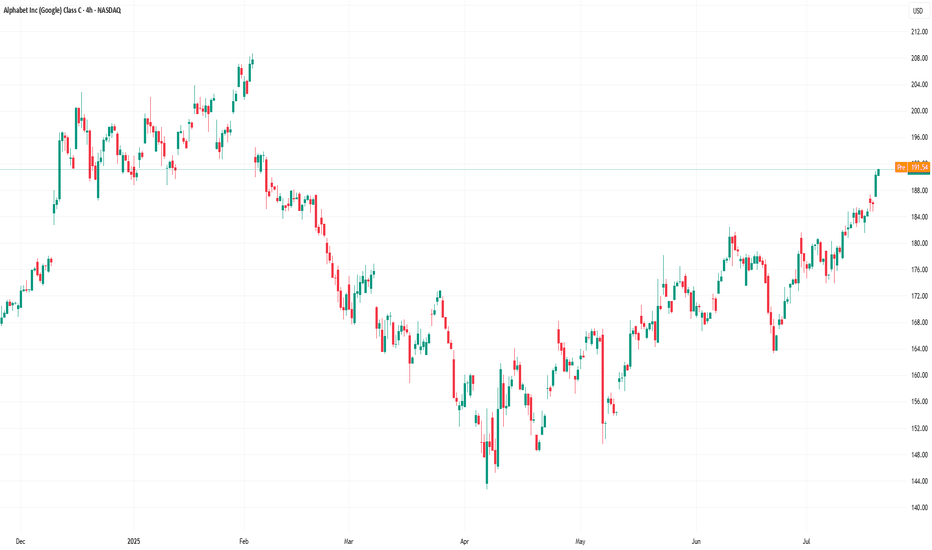
Alphabet (GOOGL) Stock Approaches $200 Ahead of Earnings Release According to the Alphabet (GOOGL) stock chart, the share price rose by more than 2.5% yesterday. Notably: → the price reached its highest level since early February 2025; → the stock ranked among the top 10 performers in the S&P 500 by the end of the day. The positive sentiment is driven by...
Market Insights with Gary Thomson: RBA Minutes, BoJ Speech, ECB Decision, UK Sales, Earnings Reports In this video, we’ll explore the key economic events, market trends, and corporate news shaping the financial landscape. Get ready for expert insights into forex, commodities, and stocks to help you navigate the week ahead. Let’s dive in! In this episode of...
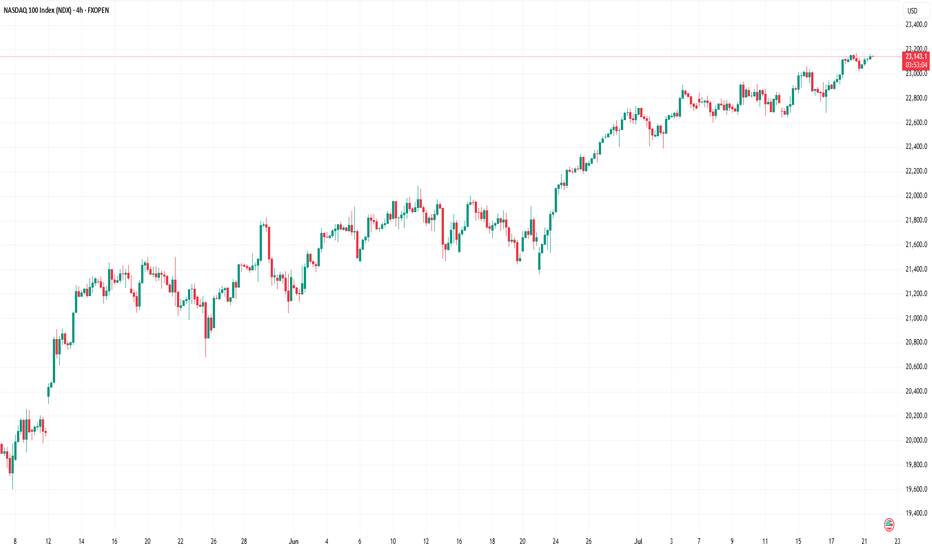
Nasdaq 100: Market Optimism Builds Ahead of Big Tech Earnings The earnings season is gaining momentum. This week, major technology companies such as Alphabet (GOOGL) and Tesla (TSLA) are scheduled to release their quarterly results. Given that 85% of the 53 S&P 500 companies that have already reported have exceeded analysts’ expectations, it is reasonable to...
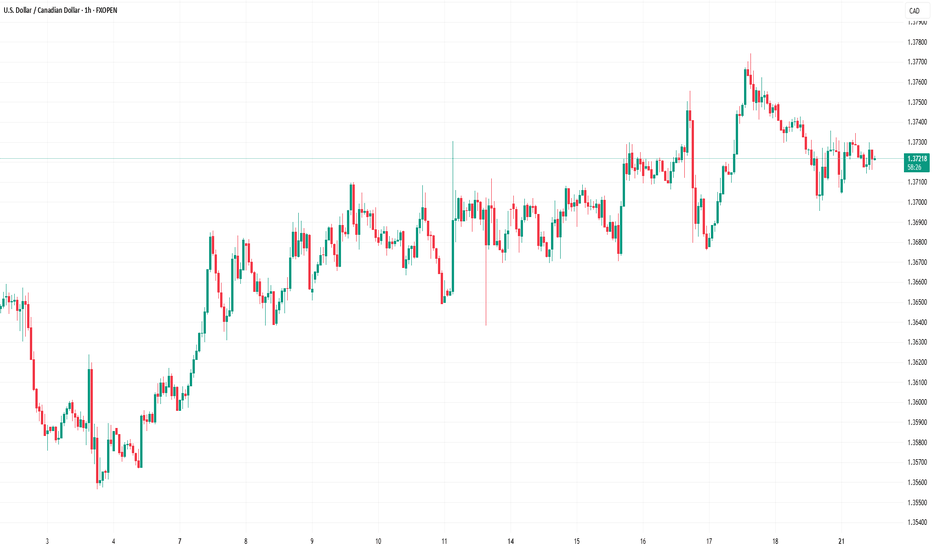
Market Analysis: USD/CAD Consolidates Gains USD/CAD declined and now consolidates below the 1.3750 level. Important Takeaways for USD/CAD Analysis Today - USD/CAD started a fresh decline after it failed to clear the 1.3775 resistance. - There is a key bullish trend line forming with support at 1.3715 on the hourly chart at FXOpen. USD/CAD Technical...
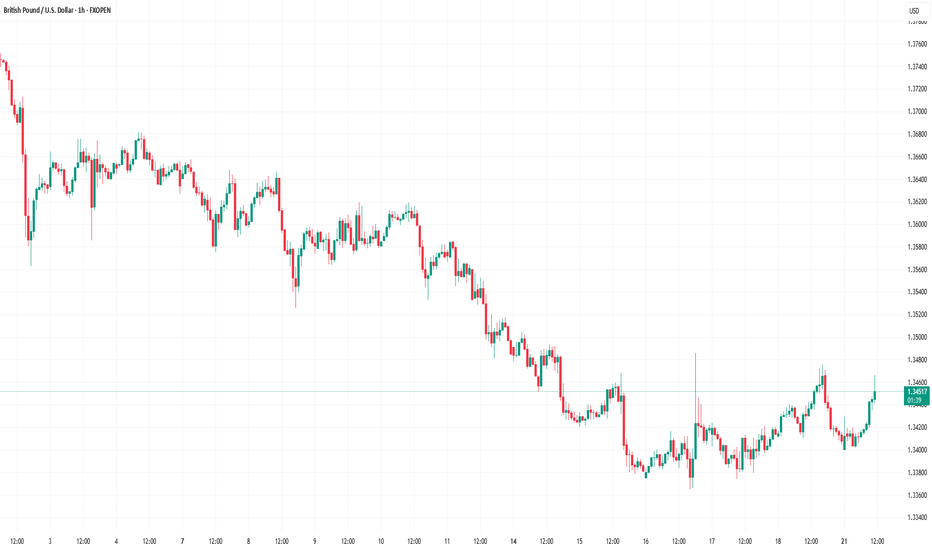
Market Analysis: GBP/USD Dips Further GBP/USD started a downside correction from the 1.3620 zone. Important Takeaways for GBP/USD Analysis Today - The British Pound started a fresh decline and settled below the 1.3500 zone. - There is a connecting bullish trend line forming with support at 1.3415 on the hourly chart of GBP/USD at FXOpen. GBP/USD Technical...
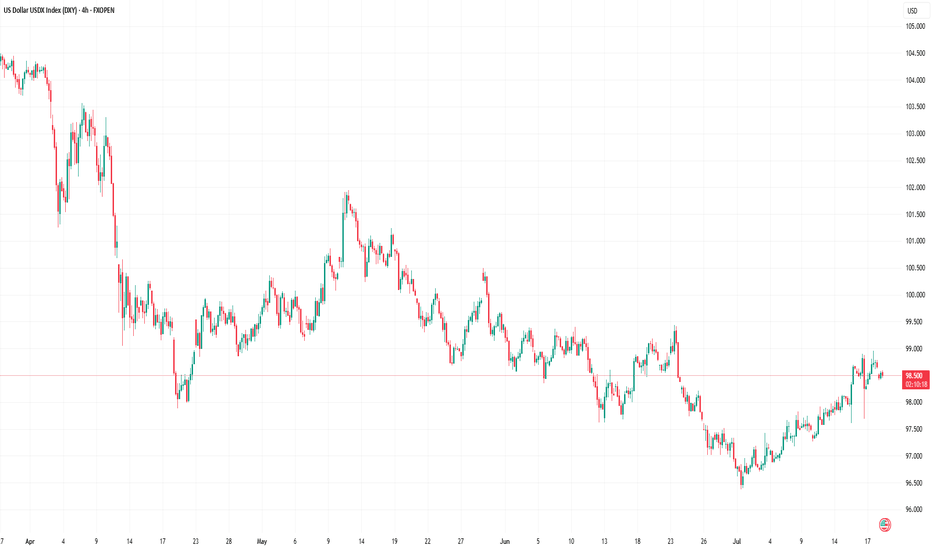
US Dollar Index (DXY) Chart Analysis The addition of the US Dollar Index (DXY) to FXOpen’s suite of instruments offers traders potential opportunities. This financial instrument: → serves as a measure of the overall strength of the US dollar; → is not tied to a single currency pair but reflects the value of the USD against a basket of six major global...
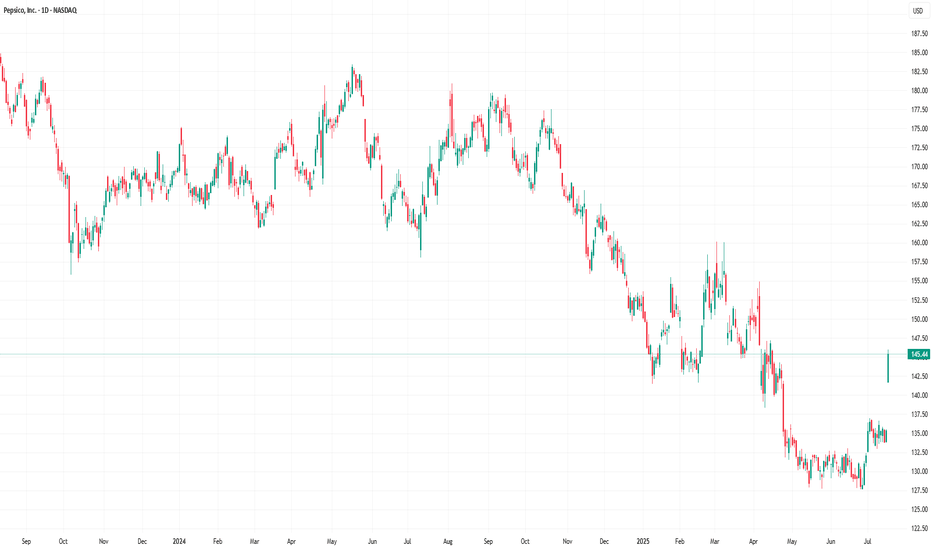
PepsiCo (PEP) Stock Rallies 7.4% Following Earnings Report – What Comes Next? Yesterday, PepsiCo Inc. (PEP) released its quarterly earnings report, which significantly exceeded market expectations: → Earnings per share (EPS) came in at $2.12, surpassing the forecast of $2.02. → Gross revenue reached $22.7 billion, above the projected $22.3 billion. In addition,...
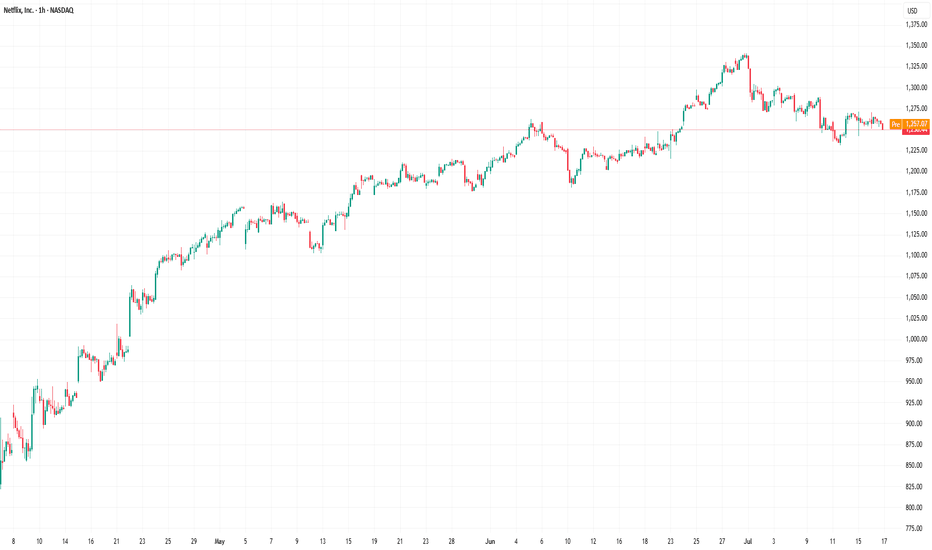
How Earnings Reporting Could Impact Netflix (NFLX) Share Price Earnings season is gaining momentum. Today, after the close of the main trading session, Netflix (NFLX) is set to release its quarterly financial results. Analysts are optimistic, forecasting earnings per share (EPS) of $7.08, up from $4.88 a year earlier, and revenue growth to $11.1 billion. The...
XAU/USD Chart Analysis: Volatility at a Yearly Low The daily chart of XAU/USD shows that the Average Directional Index (ADX) has reached its lowest level since the beginning of 2025, indicating a significant decline in gold price volatility. Yesterday’s release of the US Producer Price Index (PPI) initially triggered a sharp spike in gold prices, but the gains...
