Market analysis from FXOpen
Advanced Order Types in ECN Trading Electronic Communication Networks (ECN) have transformed the landscape of financial trading, offering direct market access and enhanced transparency. Central to ECN trading is the use of various order types, each tailored to specific strategies and risk management approaches. This article delves into advanced order types,...
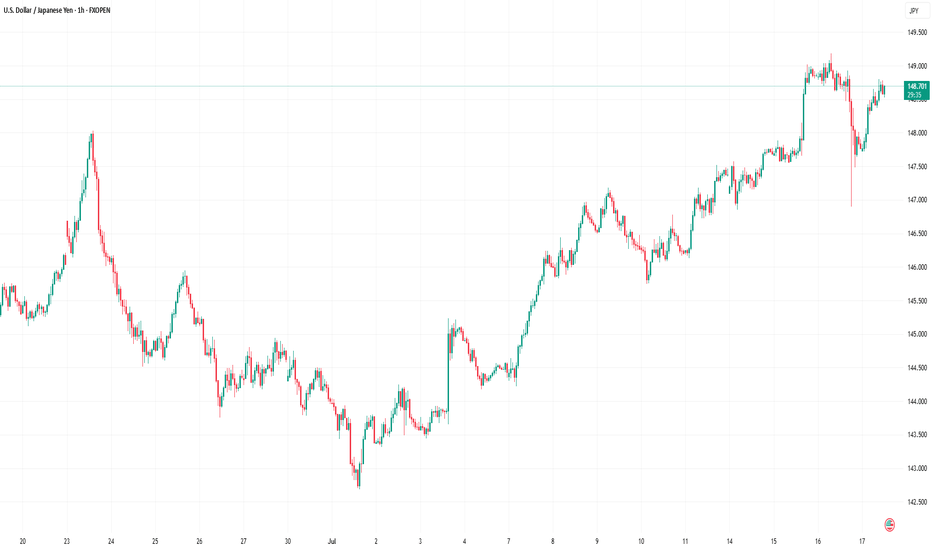
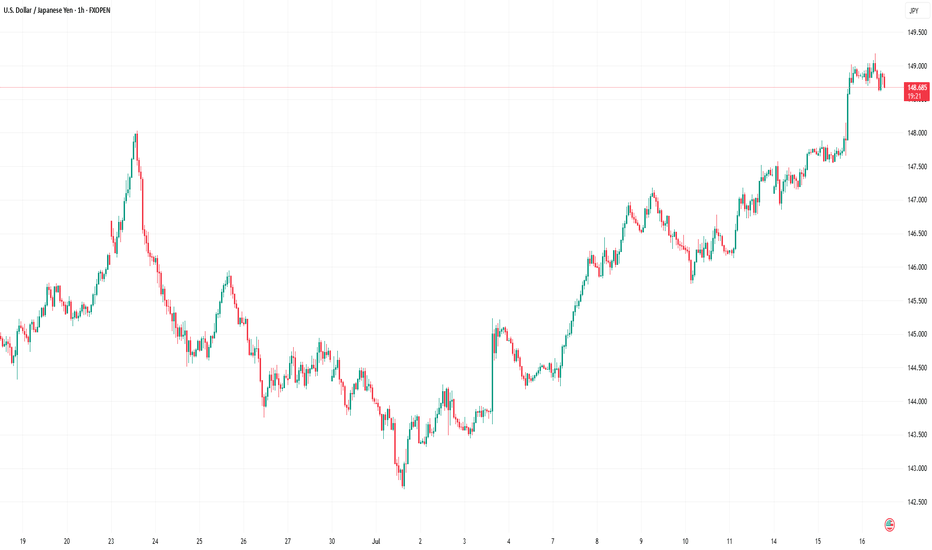
Market Analysis: USD/JPY Rises USD/JPY is rising and might gain pace above the 149.20 resistance. Important Takeaways for USD/JPY Analysis Today - USD/JPY climbed higher above the 147.50 and 148.40 levels. - There is a key bullish trend line forming with support at 148.40 on the hourly chart at FXOpen. USD/JPY Technical Analysis On the hourly chart of...
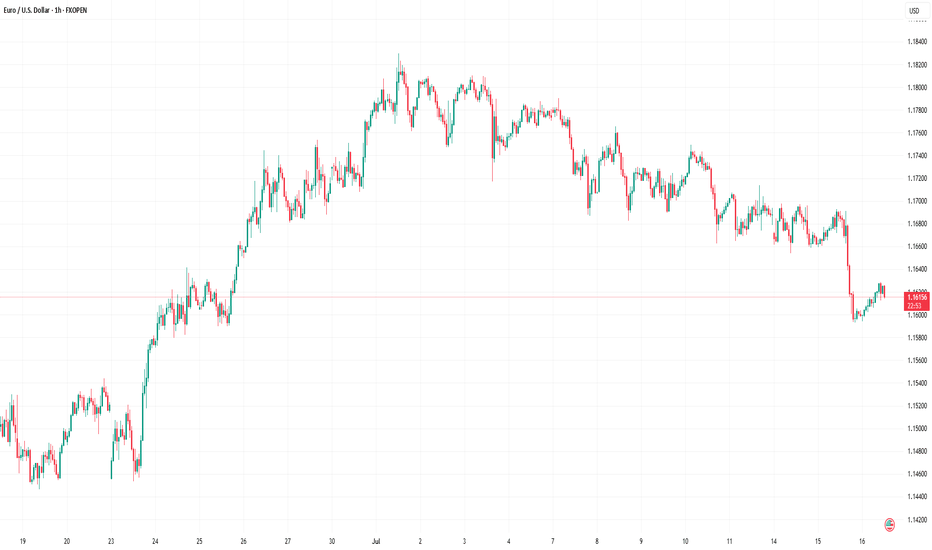
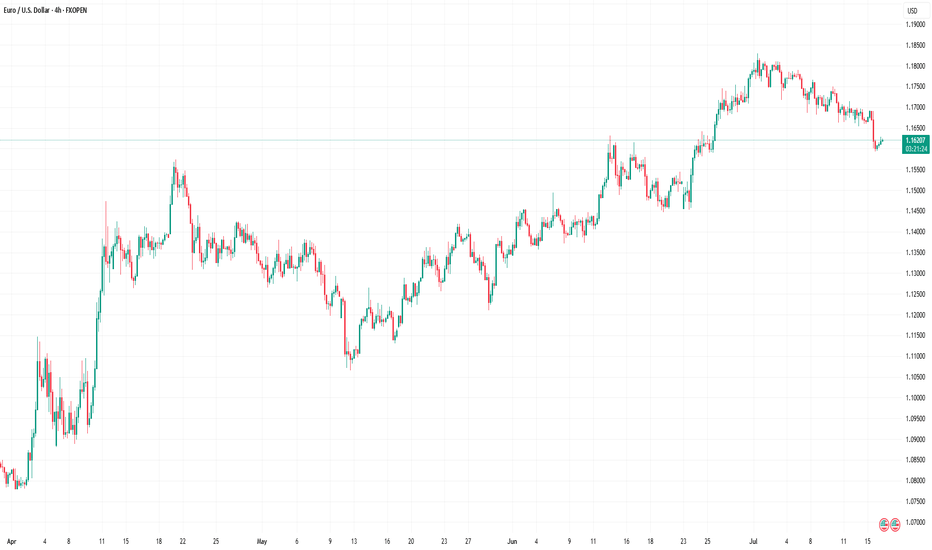
Market Analysis: EUR/USD Pares Gains EUR/USD declined from the 1.1750 resistance and traded below 1.1650. Important Takeaways for EUR/USD Analysis Today - The Euro started a fresh decline after a strong surge above the 1.1720 zone. - There is a connecting bearish trend line forming with resistance at 1.1660 on the hourly chart of EUR/USD at FXOpen. ...
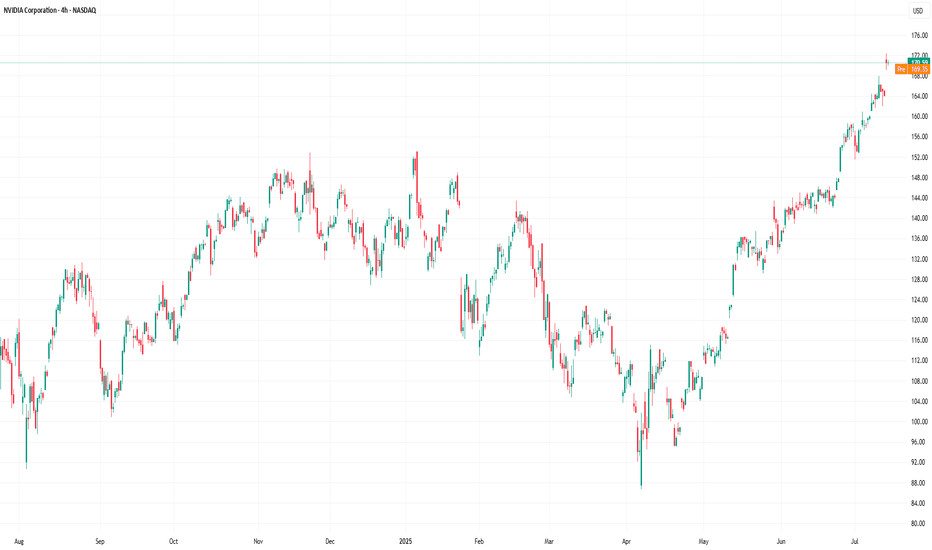
Nvidia (NVDA) Share Price Surges Above $170 Yesterday, Nvidia’s (NVDA) share price rose by more than 4%, with the following developments: → It surpassed the psychological level of $170 per share; → Reached another all-time high; → Gained more than 9% since the beginning of the month. The bullish sentiment is driven by Nvidia CEO Jensen Huang’s visit to China...
EUR/USD Analysis: US Dollar Strengthens Following Inflation Report Yesterday, the US Consumer Price Index (CPI) report was released, showing an increase in consumer prices. According to Forex Factory, annual CPI rose from 2.4% to 2.7%, exceeding analysts' expectations of a 2.6% rise. As reported by Reuters, the data supports the stance of Federal Reserve Chair...
A Closer Look at the Role and Recent Volatility of the US Dollar Index (DXY) We don’t even need to say that the US Dollar Index (DXY) is one of the most influential benchmarks in global currency markets. The index, which measures the value of the US dollar against a basket of six major currencies, experiences heightened volatility and presents potential...
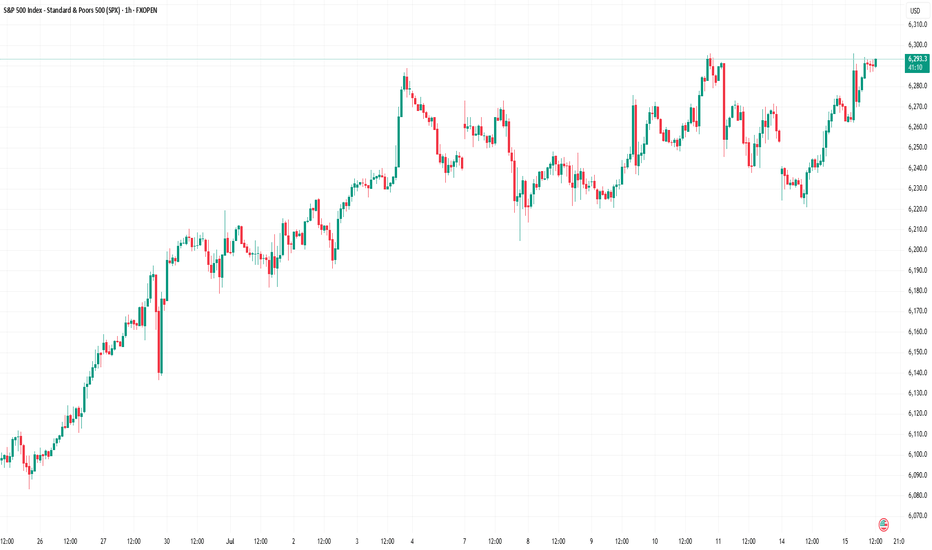
Equity Markets Ahead of the US Inflation Report Today at 15:30 GMT+3, the US inflation report (Consumer Price Index, or CPI) is scheduled for release. According to ForexFactory, analysts expect the inflation rate to rise from 2.4% to 2.6%. The actual figures will provide market participants with grounds to debate not only the likelihood of a Federal Reserve...
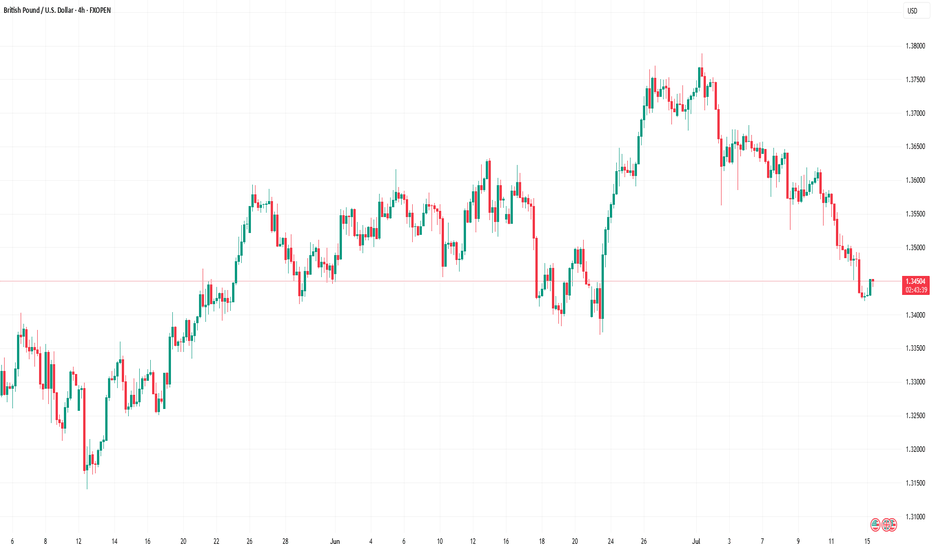
GBP/USD Rate Falls to Key Support Level As of today, the GBP/USD chart indicates that the British pound has declined by more than 2% against the US dollar since the beginning of July. Notably, the pace of the decline accelerated on Friday and continued into Monday. According to Reuters, the pound is under pressure due to market concerns over a potential...
Market Insights with Gary Thomson: Inflation Rate in Canada, US, and UK, US PPI, Earnings Reports In this video, we’ll explore the key economic events, market trends, and corporate news shaping the financial landscape. Get ready for expert insights into forex, commodities, and stocks to help you navigate the week ahead. Let’s dive in! In this episode of Market...
DAX Stock Index Declines Amid Trump Tariff Threat The German stock index DAX 40 (Germany 40 mini at FXOpen) is showing bearish momentum at the start of the week. This may be driven by a combination of factors, the most significant of which is the threat of tariffs on Europe from the United States. According to Reuters, US President Donald Trump has announced a...
Market Analysis: WTI Crude Oil Climbs Higher Amid Market Optimism WTI Crude Oil price climbed higher above $66.50 and might extend gains. Important Takeaways for WTI Crude Oil Price Analysis Today - WTI Crude Oil price started a decent increase above the $66.60 resistance levels. - There was a break above a connecting bearish trend line with resistance at...
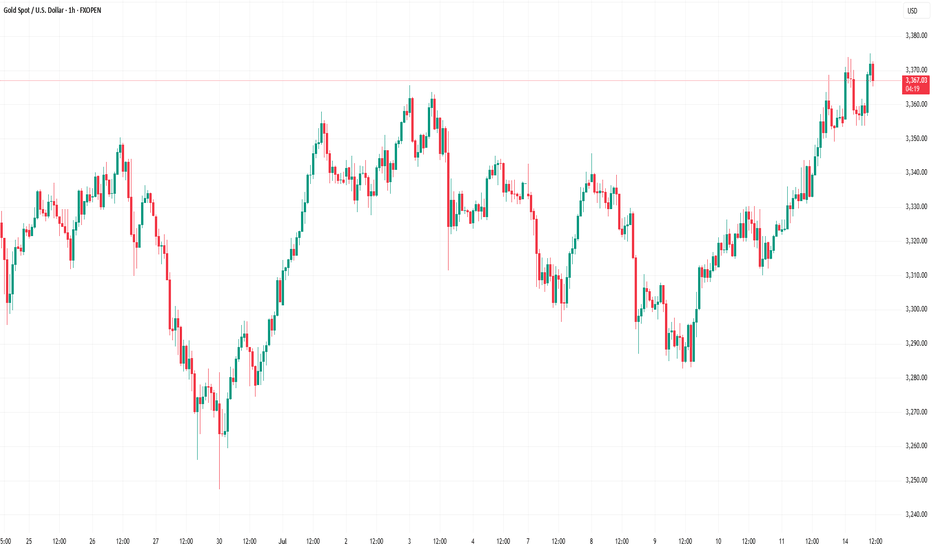
Market Analysis: Gold Climbs Higher Amid Market Optimism Gold price started a fresh increase above the $3,350 resistance level. Important Takeaways for Gold Price Analysis Today - The gold price started a fresh surge and traded above $3,330. - A key bullish trend line is forming with support at $3,350 on the hourly chart of gold at FXOpen. Gold Price...
US Dollar Strengthens Following Trump’s Tariff Decision US President Donald Trump has announced his decision to impose new tariffs: → For Canada, tariffs are set at 35%. They are scheduled to take effect on 1 August, although negotiations may take place before this date, potentially influencing Trump’s final stance. → For many other countries, tariffs may be set...
Coinbase (COIN) Shares Reach All-Time High According to the chart of Coinbase Global (COIN), the share price of the cryptocurrency exchange has reached a historical all-time high (closing price). The bullish sentiment has been supported by the following factors: → Bitcoin price rally. Yesterday, we analysed the BTC/USD chart and anticipated that bulls might...
Forex Market Depth Analysis and Trading Strategies Forex market depth analysis offers traders a deeper understanding of currency market dynamics. It reveals the real-time volume of buy and sell orders at different prices, which is crucial for assessing liquidity and trader sentiment. This article explores how to analyse and use market depth for trading,...
Nvidia Market Capitalisation Reaches $4 Trillion Yesterday, Nvidia’s (NVDA) share price surpassed $162 for the first time in history. As a result, the company’s market capitalisation briefly exceeded $4 trillion during intraday trading (according to CNBC), making Nvidia the first publicly listed company to reach this milestone. The rise in NVDA’s share price is...
Intel (INTC) Share Price Hits 3-Month High Without Clear Catalyst Intel Corporation (INTC) stocks rose by over 7% yesterday, making them one of the top performers in the S&P 500 index (US SPX 500 mini on FXOpen). As a result, the stock price reached its highest level in three months. What’s notable is the apparent lack of clear drivers behind the rally....
EUR/JPY Hits 12-Month High As the chart indicates, the EUR/JPY pair has risen above ¥172 per euro — a level last seen in July 2024. Since early June, the exchange rate has increased by approximately 5.6%. This upward movement is driven by a combination of factors, including: → Divergence in central bank policy: The European Central Bank’s key interest rate...
