Market analysis from Fusion Markets
Price has been bullish since April this year with the most recent price action forming a parallel channel. On Friday we saw a solid break lower and close below the channel. This could possibly lead to further downside. Look for a trade that meets your strategy rules.
Price has rejected the support trendline for a third time. It's possible that we will now see buyers step in but we need to see higher highs and lows form to confirm. Look for a trade that meets your strategy rules if you agree.
Price has rejected 146.00 for the second time this month as buyers currently regard this as a high value area. Next stop could be 149.00 which was the last daily resistance zone, rejected this month. If you agree with this analysis, look for a trade that meets your strategy rules.
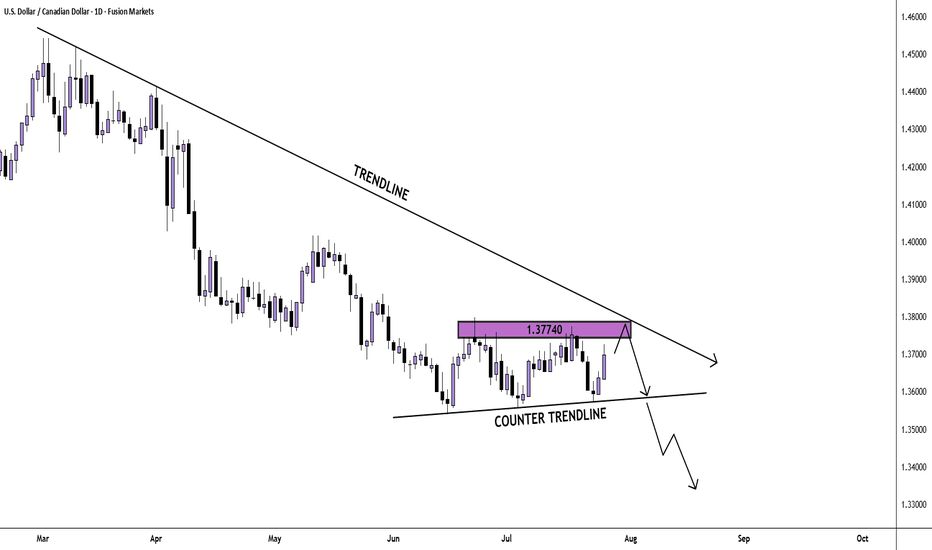
From the bigger picture we see that sellers are dominating the market. Currently, price looks to be in a correction phase and twice has found resistance at the 1.37740 price point. If price finds resistance there again, we may see a breakout and another bearish impulse. If you agree with this analysis, look for a trade that meets your strategy rules.
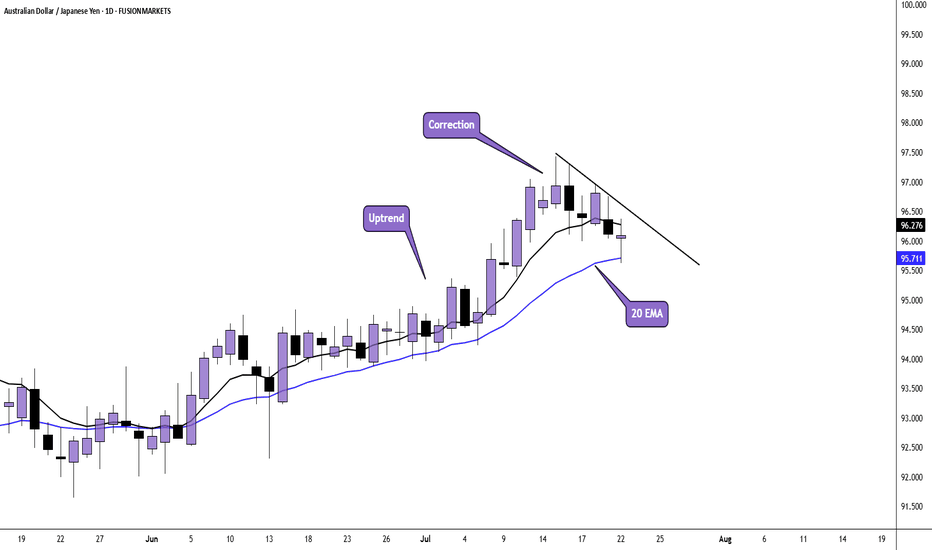
Price is in a daily uptrend and has pulled back to the 20 EMA. Price may find support here and could see the next bullish impulse. Wait for the breakout and a buy setup that meets your strategy rules if you agree.
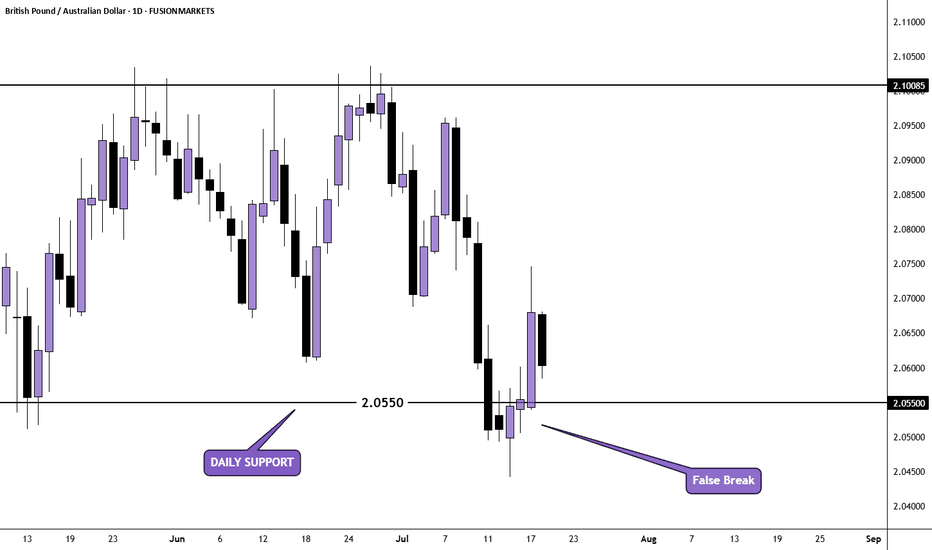
Price was ranging between resistance at 2.10085 and support at 2.05500 After breaking below support last week, price retested but then closed back above (false break). We may now see buyers step in again. If you agree with this analysis, look for a trade that meets your strategy rules.
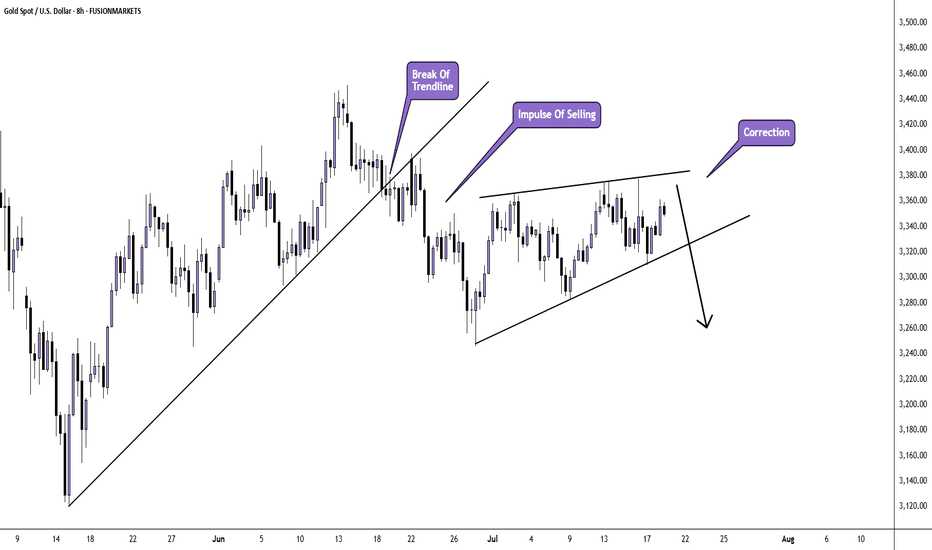
After breaking the bullish trend last month, we saw an impulse of selling and a low price of $3245 per troy ounce. Since then, a corrective pattern has been forming. Will we see another impulse of selling after the correction is over? If you agree with this analysis, look for a trade that meets your strategy rules.
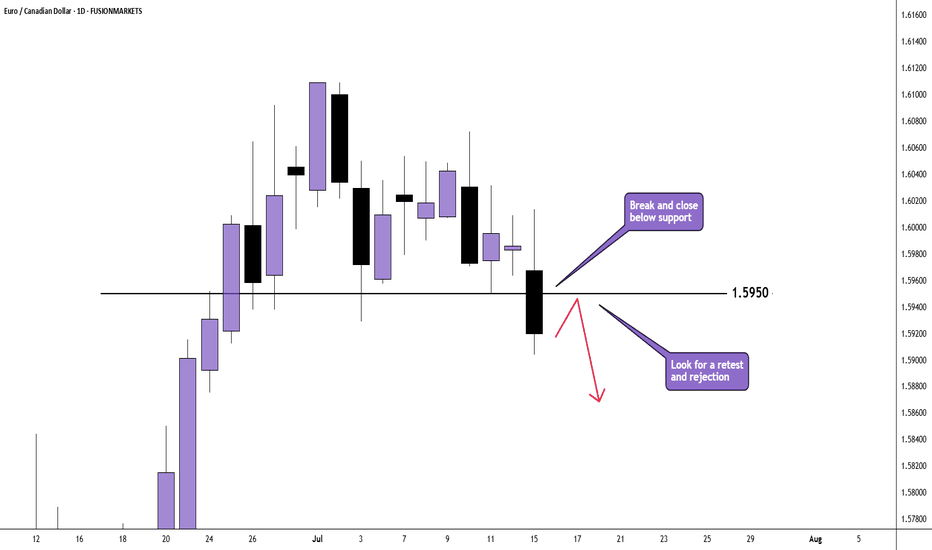
Price has broken and closed below 1.5950 which was support over the last few days. Look for a pullback, retest and rejection. If you agree with this analysis, look for a trade that meets your strategy rules.
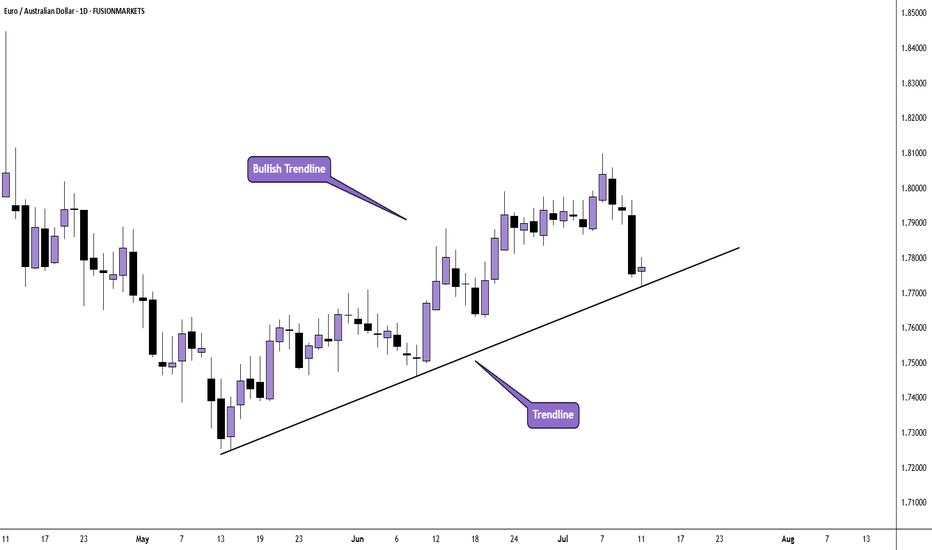
With price in a bullish trend and printing a Doji candle at the trendline, we may now see buyers step back into the market once again. If you agree with this analysis, look for a trade setup that meets your strategy rules.
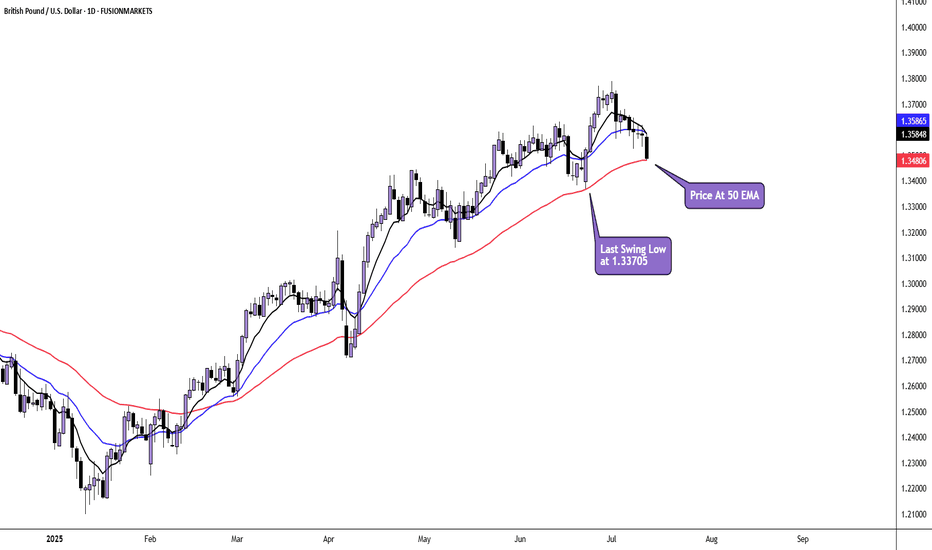
Price is in a daily uptrend and has pulled back to the 50 moving average. Here, price may find support and set up for another bullish impulse. However, if price breaks the last swing low at 1.33705, we may have seen a top formed and a change in sentiment. If you agree with this analysis. look for a trade that meets your strategy rules.
The overall sentiment of USD/CHF is bearish on the daily chart. Price is currently correcting the last impulse of selling. We may see price head further towards the trendline. If you agree with this analysis, look for a trade that meets your strategy rules.
Price appears to be correcting the huge bullish impulse move which originated on 23rd June 2025 and ended on 1st July 2025. We have already seen an impulse from the sellers after price peaked at 1.37887 at the beginning of the month. Current price action is taking the form of a correction and there is the potential of another move down. If you agree with this...
Price is moving within a bullish channel, which is itself situated inside a bigger bullish structure. The most recent price action appears to be a consolidation within the uptrend. Price may possibly be setting up for another impulsive move towards the top of structure for a 3rd test. If you agree with this analysis, look for a trade that meets your strategy rules.
Price has found resistance at a price of 2.1000 for a number of days. Mondays large bearish candle suggests that the price is still finding a ceiling at that price point. This means that we could see some further selling. If you agree with this analysis, look for a trading opportunity that meets your strategy rules.
Price is bullish but has entered an area of resistance where price last rejected back in December 2024. Look for price to reject and change in cycle on the smaller time frames. If you agree with this analysis, look for a trade that meets your strategy rules.
Price is bullish on the daily time frame. After 4 consecutive bullish days, price printed a bearish inside candle on Friday. This could potentially be the start of a correction back towards the moving averages and possibly towards the first Fibonacci retracement levels (38.2% and 50%). If you agree with this analysis, look for a trade that meets your strategy rules.
Price has been testing support at 1.09400 for a number of days. Failure to break lower could mean buyers step in and a possible range playing out with a potential target of 1.1180 If you agree with this analysis, look for a trade that meets your strategy rules.
Price has broken below the daily trendline, where it found support on four separate occasions. When retesting the trendline last week, price appeared to reject with 2 consecutive 4 hour bearish candles. If you agree with this analysis then look for a sell setup that meets your strategy rules.


