Market analysis from Fusion Markets
Price has closed below the CTL (counter trendline) on the final day of trading last week. The current bearish trend started in February and has most recently been in a potential corrective pattern where it retested and rejected 0.6200 We may now see a push from the sellers back towards major support at 0.6060 unless the current break below the CTL is a false...
The daily chart shows price is making higher highs and higher lows since price bottomed out at circa 187.00 in February this year. The moving averages are bullish with angle and separation showing a strong trend. With price back at the 8 EMA (black line), we may see a change of sentiment on the smaller time frames if it acts as support. Failing that, we could...
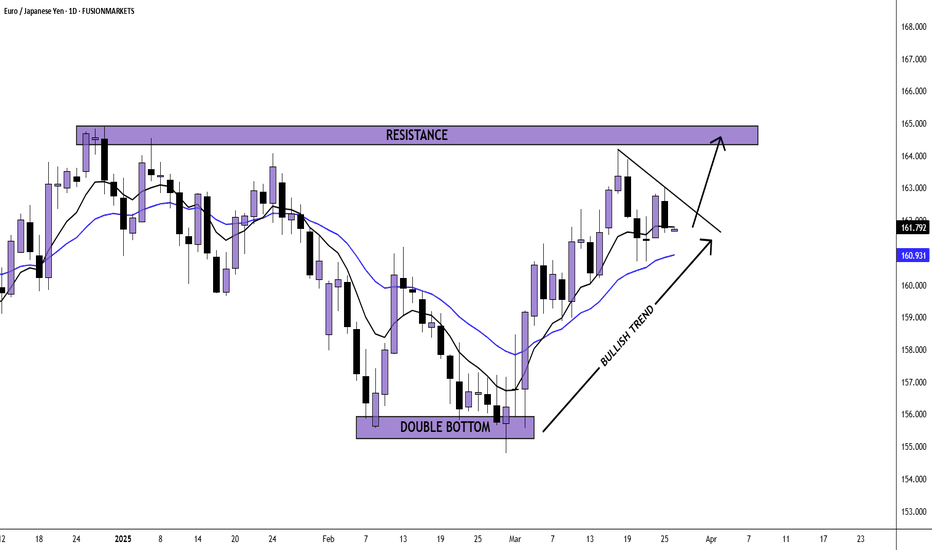
After printing a double bottom circa 155.50 in February, price has seen a steady move to the upside. Price appears to be currently correcting. Look for a break to the upside and a potential long trade (if it meets your strategy rules) into 164.50 which was resistance in December 2024.
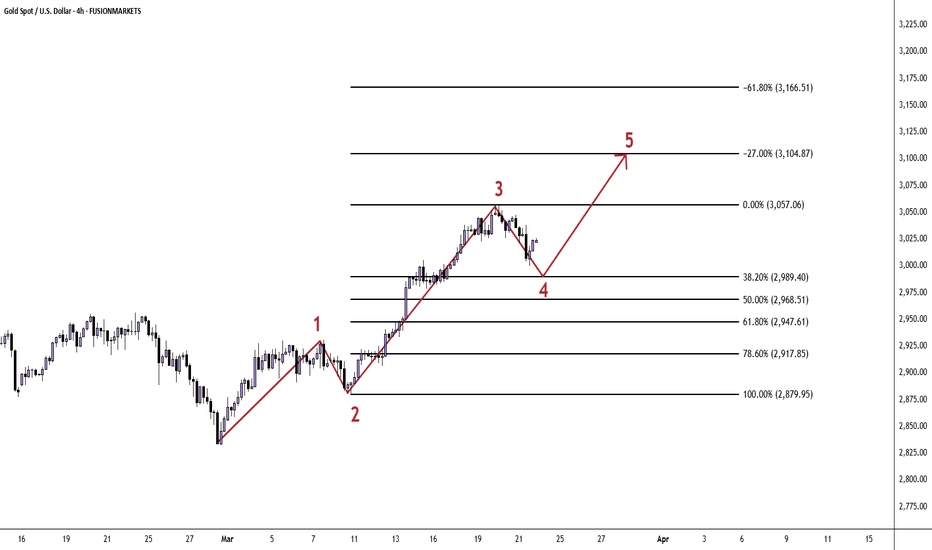
Gold well and truly smashed through the $3000 barrier this week, peaking at around $3057 per troy ounce. Looking at the 4 hour chart, we may see one more impulse of buying after the current corrective move. This correction may head towards the 38.2%/50%/or 61.8% Fib retracement levels (if you use them in your trading). If we do see another bullish impulse then...
There is a lack of trend in the current AUD/USD price action. Instead, price appears to be moving within a range from 0.6200 to 0.6400 In the centre of the range is a daily support of 0.6277 which price closed below on Friday. Potentially, this could now mean further downside towards the bottom of the range.
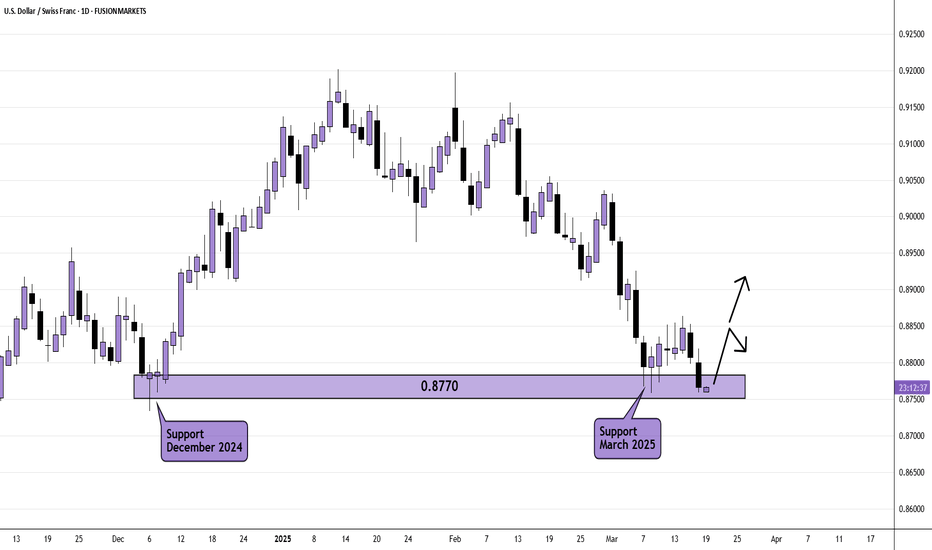
Price is back at daily support (tested and rejected in December 2024 and most recently March 2025). Tuesdays daily candle saw a bearish close at the level. If price breaks the high on Wednesday, we could see 0.8850 tested again. From there, price could reject (again) or push higher. The upcoming FOMC statement could change everything though.
At the end of last week, USD/CAD sat at current 4 hour support at 1.4360 A reversal pattern here next week could lead to a long trade targeting 1.4445 which was the most recent 4 hour resistance. However, a 4 hour close below 1.43600 could lead to sells with a potential target of 1.4286
The bullish weekly trend for EUR/NZD continues but have the buyers run out of steam for now? Examining the weekly price action. we see that after 2 weeks of strong buying, the last week ended in a Shooting Star candle (also known as a pin candle). This may be a sign that buying pressure has decreased and a natural pullback/correction is now in play. Watch for...
With price now hitting previous resistance at 1.0940, we may now start to see a correction in the market after the latest 500+ pip move from the bulls. Watch for a change of cycle on smaller time frames.
With a strong weakening of the US Dollar, EUR/USD has changed it's bearish trajectory. The low of the bear move occurred on 13th January 2025 when price printed a Hammer candle/pin candle. We have since seen a gradual push from the buyers until last week when we witnessed strong, impulsive moves breaking and closing above 1.0600 resistance. We may now see a...
Since testing and rejecting the demand zone at 1.1170 for a second time, we have seen price gradually descend back towards the rising trendline. Thursdays price action saw a close below the trendline and a possible push from the sellers to test the water. Friday saw buyers back in play but price still closed below the broken trendline. Retest of the trendline...
Price has reached resistance at the top of the parallel channel. Tuesdays candle closed as a bearish pin candle. This may be the start of sellers entering the market. An impulse of selling and a correction may produce a sell setup if it meets your trading rules.
After seeing divergence between price and the MACD, Gold finally topped out around the $2955 mark. This saw the end of a bullish impulse originating at the end of last year and the start of a correction. Using Fibonacci retracement levels, we can estimate where Gold may pull back to. In this case, Fibonacci levels are potential areas of support as we are looking...
Price is moving within a bullish channel since the end of September 2024. From late December to this week, price has been moving within a correction pattern. On Friday we saw the 1st bullish close outside and above the pattern. Look for a pullback/correction and a continuation to test the wick high at 1.8650 from August 2024.
Price has made a strong rejection of the monthly supply zone at 1.4650 to 1.47 With this information in mind, there may be opportunities to short this pair on smaller time frames. Look for sell setups that meet your rules.
Price bottomed out in February at 0.5516 after entering monthly support. Since then we have seen a steady influx of buying, most recently peaking at 0.5772 during last weeks trading. With MACD divergence though, we may now see a correction back to the trendline.
Buyers were very much in charge of the market until October 2024 last year when we saw Silver peak around $34.85 From there we saw a decline as sellers took price to $28.76 over the next few months into December 2024. With price having now broken out of the triangular correction and respecting a bullish trendline, buyers are now firmly in charge until further notice.
On 11th February, price printed a break out above the bearish trendline. After forming a new high around 108.31, we then saw a slow decline as price started to correct. Look for a break to the upside for what could be another bullish impulse.


