Nice! Finally, a broker I can rely on. Their Markets.com customer support helped me set up everything in minutes. And TradingView verified? Say no more!
Woohoo! A broker that understands traders. Their low spreads and fast withdrawals make them a dream to work with. TradingView verification was the cherry on top.
Finally, a broker I can trust! Their execution speed is insane, and no slippage so far. It's the real deal, especially for someone like me who trades daily.
Had a few questions when I started, and customer service was quick to help. The TradingView integration on Markets.com is smooth, and trading is straightforward. Solid platform for everyday trading.
The AUD/NZD pair is currently exhibiting signs of a false breakout at the resistance level of 1.1145, subsequently forming a rejection Pinbar, which indicates that sellers may be regaining control in the short term.
What is a False Breakout?
A false breakout occurs when the price briefly exceeds a key support or resistance level, only to swiftly reverse and...
The EUR/CHF pair has been experiencing a prolonged downtrend over the past few months, with consistent declines culminating in a record low of 0.9208. This scenario underscores strong seller dominance, as the market continually tests new support levels.
Descending Triangle Analysis
Currently, EUR/CHF is consolidating within a descending triangle pattern. This...
The GBP/CAD pair has exhibited considerable strength since April 2024, climbing steadily until it reached key resistance at approximately 1.8070. This resistance area is close to the highest level seen since 2018, when GBP/CAD traded around 1.8400.
Following its engagement with resistance on the daily chart, the price began to show signs of exhaustion. On 12...
Since the end of September 2024, the NZD/USD pair has been in a pronounced downward trend, experiencing a depreciation of over 8% without any significant retracements. This downward movement has found crucial support around the 0.5850 level, where the price is now showing early signs of exhaustion. This support level has been tested on previous occasions,...
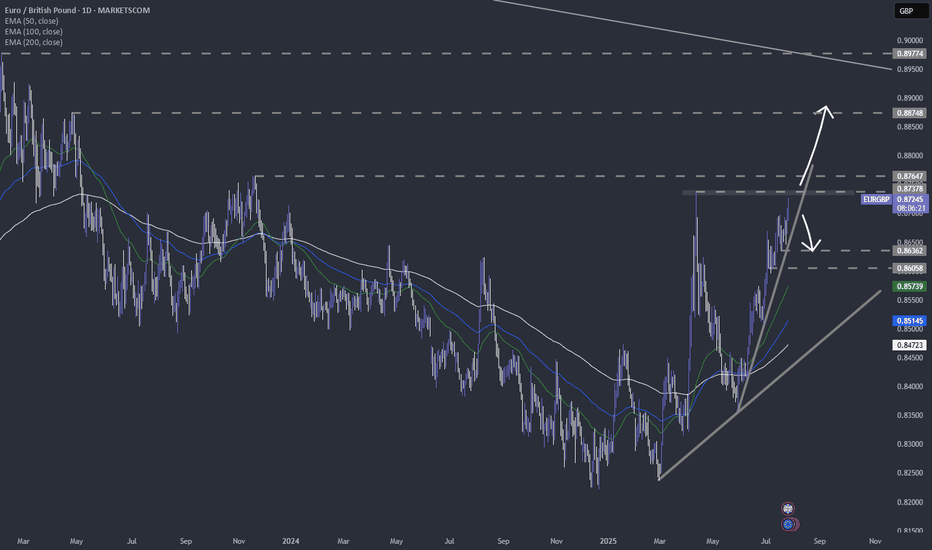
The EUR/GBP pair has been in a persistent downtrend since February 2023, reflecting the strengthening of the Pound against the Euro. However, after more than 1.5 years of decline, the pair is beginning to show potential signs of exhaustion on the daily chart. Recently, an “Engulfing” candlestick pattern has formed, suggesting a possible reversal or at least a...
The EUR/USD pair has recently broken a significant uptrend line and fallen below a crucial horizontal support level on the daily chart. This initial downward movement was triggered by Donald Trump's victory in the US presidential election. His consistent emphasis on prioritising the local economy has led the market to anticipate protective policies aimed at...