Market analysis from Saxo
Spot gold's initial response to the steepest US trade barriers in more than 100 years was a move to a fresh record high of USD 3,167 per troy ounce on heightened inflation risks, before surging volatility in response to collapsing stock markets saw traders turn their attention to capital preservation and deleveraging—the dash-for-cash focus hurt all leveraged...
Brent crude's current momentum has taken prices to a three-week high, with the latest move being supported by a combination of underinvested hedge funds, improved risk sentiment following a softening in the tone regarding tariffs after Trump indicated some nations could receive breaks from "reciprocal" tariffs starting next week on 2 April, and not least, the...
Gold reached a fresh record high above USD 3,050 an ounce before some end-of-week profit-taking, led by silver and platinum, helped trigger another, so far shallow, correction. The recent rally has pushed the price of a standard 400-ounce (12.4 kg) gold bar—held by central banks globally—above USD 1,200,000, a tenfold increase since the start of the 21st century....
WTI crude oil, under pressure for the past couple of weeks pops higher after running sell stops below $72. The rebound being supported by news the US secretary of state will modify or rescind existing sanctions waivers and cooperate with Treasury to implement a campaign "aimed at driving Iran's oil exports to zero"
Gold continues higher within its well-established channel, reaching a fresh record high at $2837. Interesting to note the spread between XAUUSD and GCJ5 continues to normalise with cash chasing higher towards the futures price. Win-win.
COMEX Gold future (Feb 2025) is once again challenging last years record high at $2801.80, supported by a softer dollar, especially against the Japanese yen and US 10-year Treasury notes testing key support around 4.5%. (NOTE: the April 2025 future has already broken higher)
EURUSD firmly rejected the attempt into the 1.0500+ area, setting up solid resistance with the three-candle evening star formation, but not yet fully posting a rejection of this rally wave unless it can work down through the 1.0350-1.0325 zone. Some tariff news will be needed for the pair to challenge the lows and set sights on parity in coming weeks, otherwise we...
The COMEX Silver futures (March 2025) is breaking higher amid an ongoing squeeze in New York on fears over import tariffs on silver potentially forcing short sellers to cover positions. Next level of resistance being the 50% retracement of the October to December correction at $32.10
Corn futures for March-25 trades near the key $5/bu area, setting a 15-month high, on worries over dry Argentine weather and lower US carryout at the end of the current crop year. The Oceanic Nino Index points to an incoming La Nina which normally brings persistent dryness to Argentina and southern Brazil, potentially worsening crop conditions, with expectations...
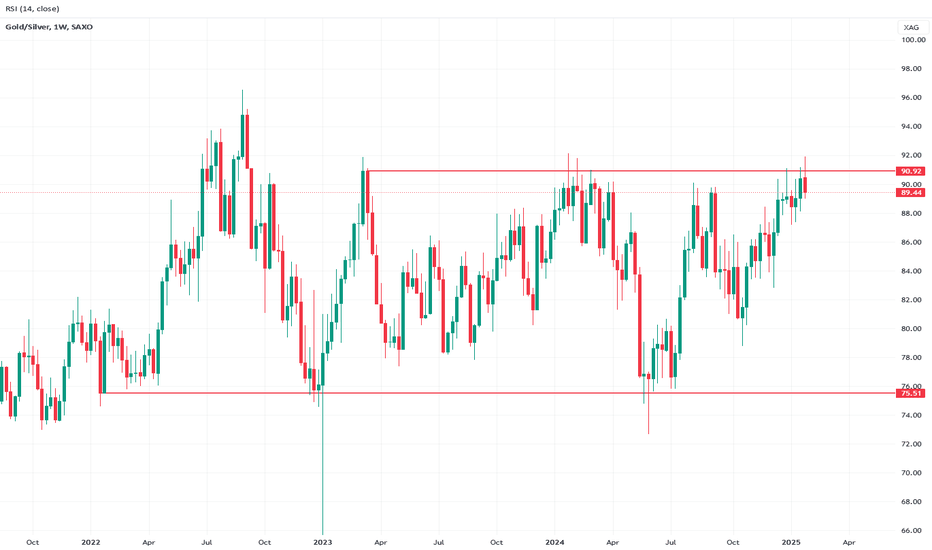
Silver is trading higher relative to gold, as the gold/silver ratio (XAUXAG) once again encountered sellers above 91. This level is becoming increasingly significant, given the number of rejections observed over the past two years.
COTTON, in a long-term decline since last February is currently stuck within a narrowing range, with a minimum break above 70 cents per pound needed to change the negative outlook. However, it is worth noting managed money accounts have held a net short position for a record-breaking 39 weeks. In the week to 21 January it reached a near record short position of...
Gold has rallied strongly this week, with the move accelerating after breaking resistance—now support—at USD 2,725, clearing the path to retest last year’s record high at USD 2,790. In our recently published Q1 2025 outlook, we reiterated our long-held bullish view on both gold and silver. Demand for investment metals continues to be fueled by an uncertain...
USDJPY has rebounded from its 0.786 retracement at 151.75. The strength indicator RSI is still showing positive sentiment with no divergence. That is a strong suggesting USDJPY is to rebound higher. An RSI close back above 60 threshold will confirm the bullish rebound picture. A bullish move over the next couple of weeks to the 0.618 retracement at 157.05 is in...
USDCHF key support at 0.90! A break below is likely to fuel a sell-off down to the 0.382 retracement of the uptrend since its December low i.e., down to 0.8883. Around that level both the 200 and 100 daily Moving Average are coming up adding to the support. RSI has been illustrating divergence for a few weeks by now indicating uptrend exhaustion However, if...
GBPUSD spiked to the 0.786 retracement at 1.2622 only to collapse back below the 0.618 retracement. RSI failing to close above 60 threshold thus still showing negative sentiment, and with no divergence indicating GBPUSD is likely to resume downtrend and push lower in coming weeks. A break below 1.2465 will confirm the bearish trend has resumed with downside...
EURUSD spiked late last week above the 55 and 200 daily Moving Averages and close to the 0.786 retracement at 1.0824 before retracing back below the 0.618 retracement at 1.0776. In three tries, EURUSD failed to close above the 0.618 retracement and RSI failed to close back above 60 thresholds. All Moving Averages are declining, putting a drag on EURUSD. The cross...
Gold (XAUUSD) is back below key support at 2,319 after failing to close above 2,350, which would have confirmed the resumption of an uptrend. If Gold breaks below 2,291, it is likely to face a sell-off down to between 2,260 and 2,255, and possibly even lower to around 2,207, which is the 0.786 retracement of the leg up since March. The strength indicator RSI has...
USDCAD seems to be attracting bids just above the 0.618 retracement and support at 1.3618. Since RSI is still showing positive sentiment with no divergence, break above 1.3731 combined with an RSI close back above 60 threshold will confirm USDCAD has resumed uptrend with upside potential to 1.3928, possibly higher A daily close below 1.3618 will reverse this...


