Market analysis from ThinkMarkets
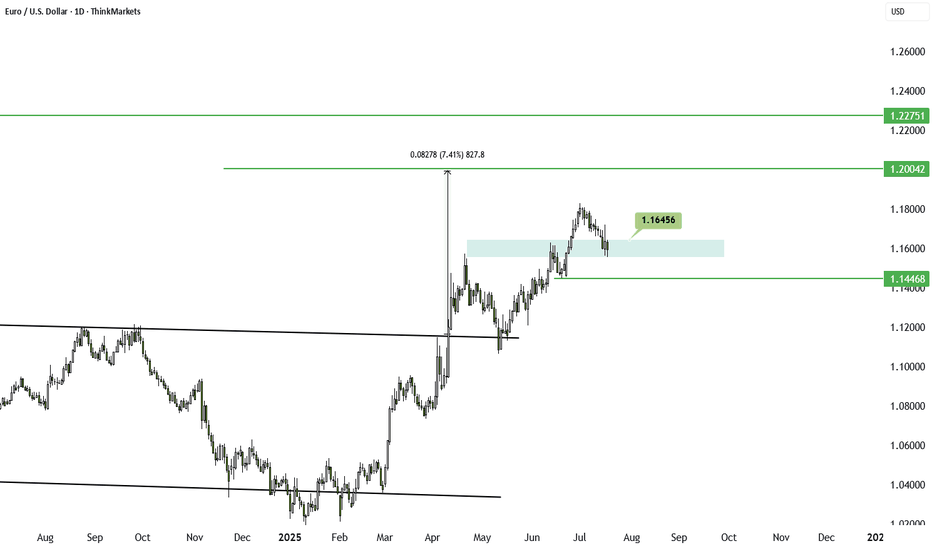
EURUSD has finally broken below the key 1.15 level, triggering a move lower in line with earlier expectations. The drop follows the US imposing fresh tariffs on European goods, a move that traditionally strengthens the currency of the tariff-imposing nation. Supporting the dollar further, the latest ADP and GDP reports came in stronger than forecast, while the...
Oil prices have climbed around 6% this week, driven by two key developments: a trade deal between the EU and the US, and Donald Trump’s warning that the US may impose sanctions on Russian oil buyers within 10 days unless progress is made toward ending the Russia-Ukraine war. Russia accounts for about 10.5% of global oil production. Major buyers like China and...
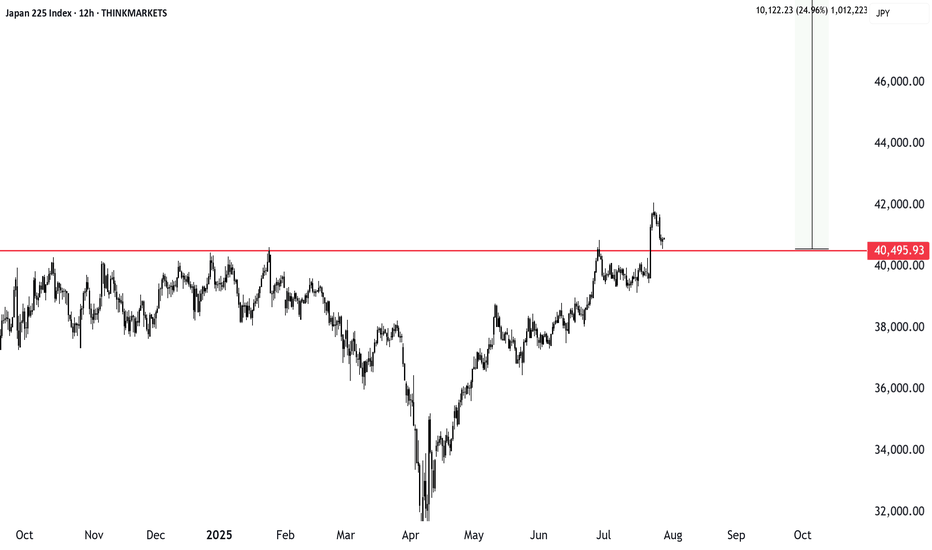
Summer breakouts are tricky with low market participation, but Japan’s stock index just cleared a major level. Whether it’s a rectangle or inverse head and shoulders, the breakout looks valid. We explore how to manage risk, trim stop losses, and aim for a solid reward ratio. Will this push continue? This content is not directed to residents of the EU or UK. Any...
The EURUSD is under pressure today, dropping nearly half a percent. This follows the new US–EU trade deal that introduces a 15 percent baseline import tariff on most goods. That means Americans buying European products must now pay 15 percent more. Naturally, markets are adjusting. When one side of a trade deal takes the hit, its currency often weakens. In this...
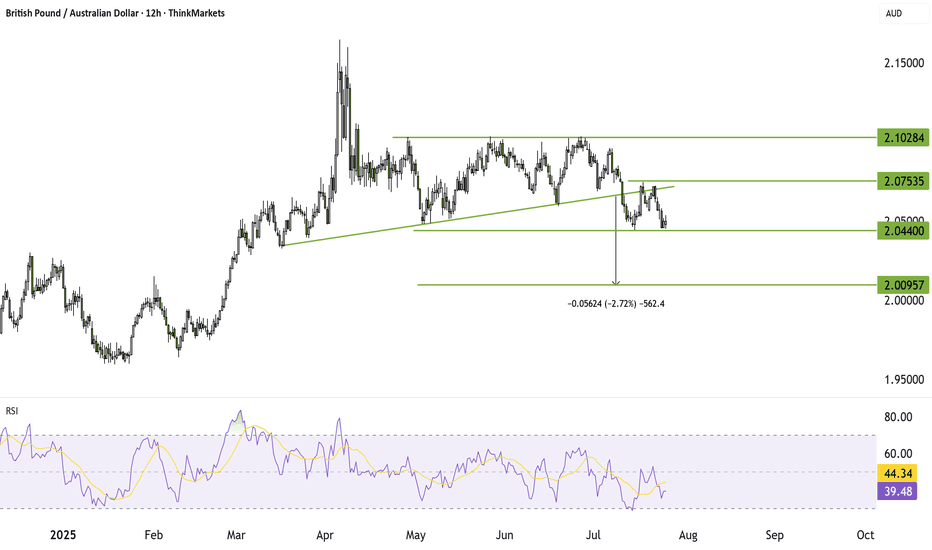
GBPAUD broke below key triangle support, confirming a bearish pattern with a target near 2.00. A failed retest strengthens the case for further downside. Bounces toward 2.06 may face selling pressure. Reward-to-risk remains attractive around 2.55x. This content is not directed to residents of the EU or UK. Any opinions, news, research, analyses, prices or...
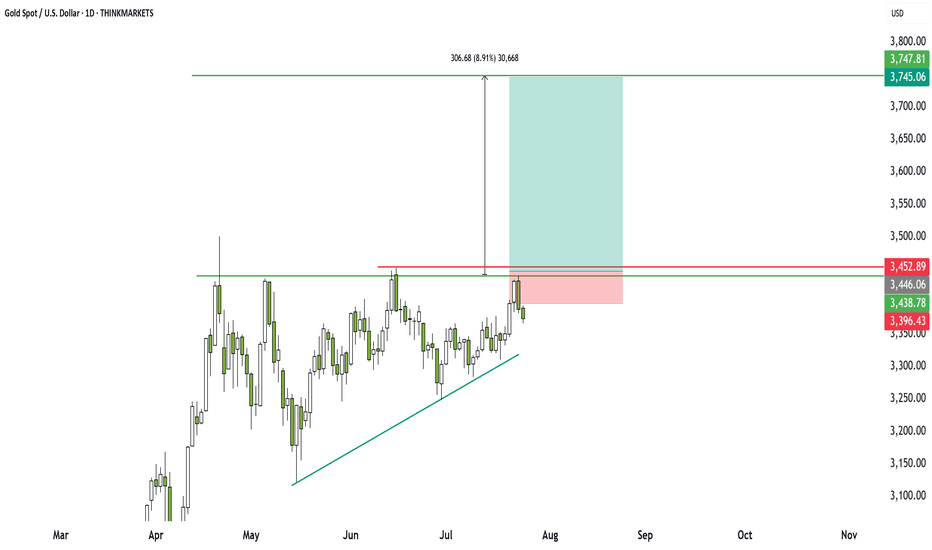
Gold has traded sideways for 93 days, but breakout traders should take note. A clear ascending triangle is forming, offering a high reward-to-risk setup. I walk through the key levels, breakout zone, and why this could lead to a 6x return. Bulls may be frustrated, but momentum is building. Are you ready? This content is not directed to residents of the EU or UK....
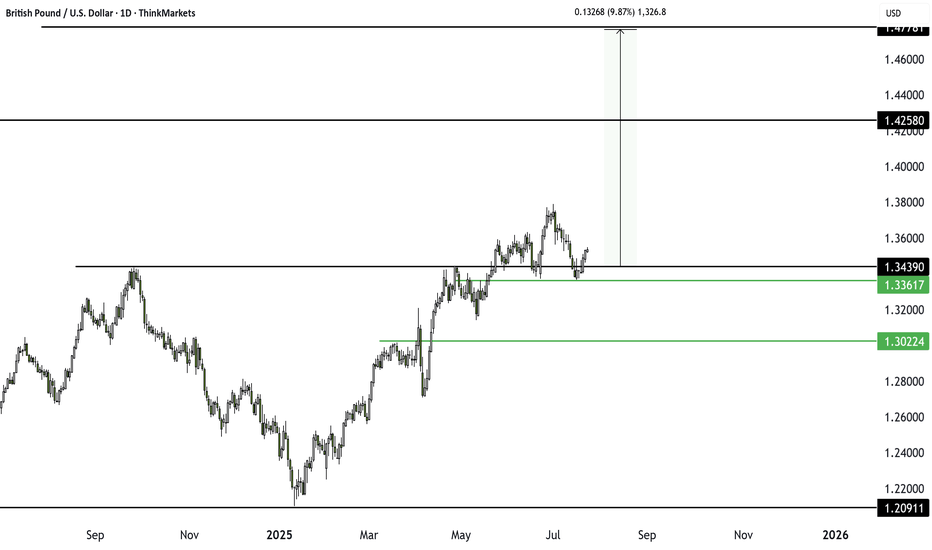
The classic rule says what doesn’t go up must come down. After a failed breakout at 1.3439, GBPUSD is struggling. With longs sitting on big gains from January’s low, a drop toward 1.3361 or even lower looks likely. Watch this key level now. This content is not directed to residents of the EU or UK. Any opinions, news, research, analyses, prices or other...
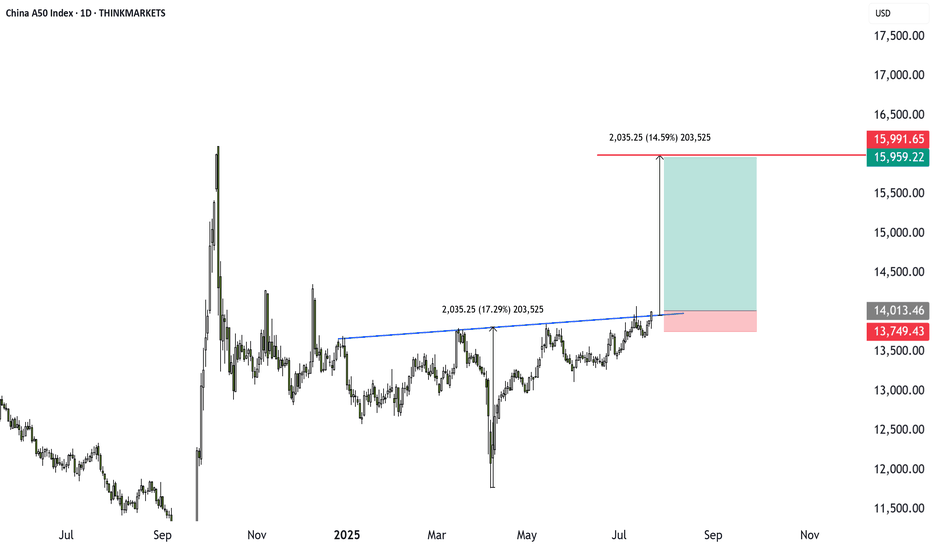
Markets are quiet, but the China A50 is heating up. A bullish inverse head and shoulders pattern has formed, backed by stimulus hopes. Target upside is 14% with a strong risk-reward setup. Are you ready to trade it, or still on holiday? This content is not directed to residents of the EU or UK. Any opinions, news, research, analyses, prices or other...
Solana just smashed our target, delivering up to 9x returns for those who held on. In this video, we break down the current setup, where the next 40% move could come from, and what to watch in funding rates and BTC dominance. Altcoins are waking up. Are you ready? This content is not directed to residents of the EU or UK. Any opinions, news, research, analyses,...
Altcoins are waking up. While Bitcoin has surged over 600% since 2022, Ethereum and smaller coins have lagged behind. But that might be changing. With ETHBTC breaking its downtrend, BTC dominance dropping, and political momentum building around crypto regulation, the stage could be set for a true altcoin season. In this video, we break down the charts, the trends,...
EURUSD remains under pressure as US jobless claims improve and Powell appears to be on his way out. Still, the impact has been limited, and the broader trend remains upward. With growing speculation around Powell’s replacement, the market may look to form a bottom. This content is not directed to residents of the EU or UK. Any opinions, news, research,...
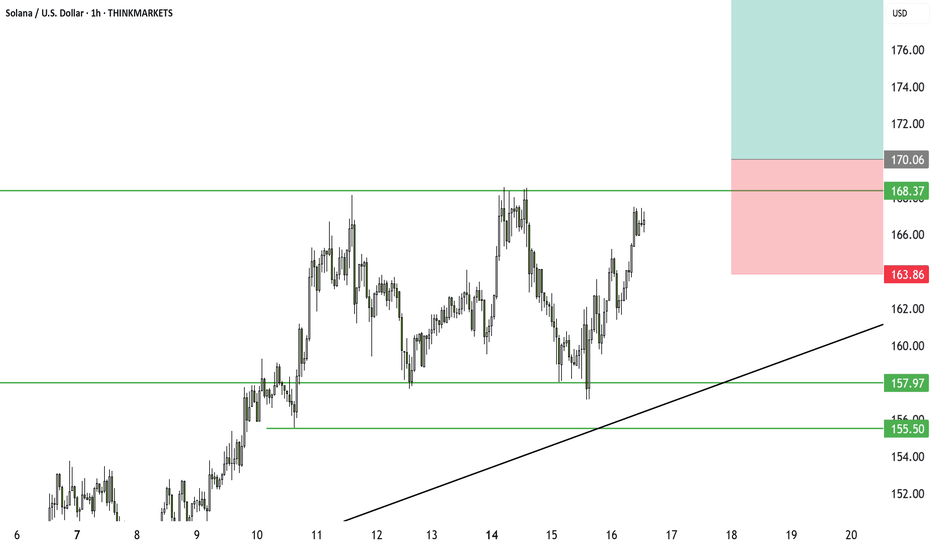
Solana is forming a clear ascending triangle. We already saw one breakout earlier, followed by a few hard retests. Now price has stalled. This might frustrate some, but I see opportunity. A clean break could deliver 14% upside. I also discuss Bitcoin, false moves, and why time stops matter in this environment. Watch closely.
Gold bugs, don’t lose hope. After weeks of sideways action, gold is showing signs of a strong breakout. We look at charts, key levels, and what could trigger the next big move.
Bitcoin just hit my first target. I went long on BTC, XRP, Chainlink, and more. Booked profits and jumped into two new breakouts with better risk-reward. In this video, I break down my trades, the setup, and why I’m still bullish between 116K and 120K. I also explain how crypto deregulation and the Genius Act could fuel the next move. Let me know in the comments...
Bitcoin is rising, but how far can it go? In this video, I walk through key tools to spot local tops, including funding rates, Twitter sentiment, and pattern targets. We also discuss setups in XRP and Solana, and what to watch ahead of the US crypto regulation update on July 22.
With BTC and XRP pushing higher, it’s increasingly likely that Solana will follow, especially as an ascending triangle pattern is forming. To learn about the levels and risk management we’re considering for this setup, watch the video.
Silver has been stuck in a sideways range for nearly a month, but a breakout may be near. A large ascending triangle hints at a possible move toward 41.37. Depending on how the market reacts, traders could aim for short-term targets with a 2.75 to 5.87 reward ratio or ride it longer for a potential 9.54. Classic markets are messy, so timing matters. Here's how I’d...
XRP has just broken out of an inverse head and shoulders pattern, a classic bullish setup that points to a potential 19% rally. The breakout comes at a time when the US is expected to deliver key crypto regulation updates by July 22. If the legal outcome is positive, it could fuel further upside not only in XRP but across the broader crypto market. This setup...


