Not financial advice
Apple has been the last laggard among the Magnificent 7. While others have already reclaimed their weekly 20 MA, AAPL has spent over seven weeks consolidating just below major resistance, potentially building fuel for a breakout.
The $205 level is the key battleground. It lines up with the .382 Fibonacci retracement from the previous high and acts as a psychological level and gamma pin. Today’s rejection at $205 reinforces its importance. If broken with volume, it could trigger a strong directional move as delta hedging unwinds into upside momentum.
🔍 Technical Outlook:
.382 Fib retracement = $205 → major inflection level
Weekly 20 MA sits just above; price compressing underneath
Bollinger Bands tightening → volatility expansion expected
MACD (weekly) flattening near a bullish cross
CMO rising, showing improving momentum under the surface
📊 Options Flow – 14-Day Snapshot:
Call Volume: $7.87M
Put Volume: $5.37M
→ Volume favors calls
Call Premium: $2.34B
Put Premium: $5.11B
→ Premium skewed toward puts, suggesting larger capital flows hedging downside or playing defense
Open Interest Cluster: Dense between $195–$300, particularly on the call side
Despite the put premium dominance, the consistent call volume and broad OI range suggest accumulation and potential bullish positioning under the surface.
🧭 Trade Thesis:
Apple is coiling at a critical intersection — Fib level, gamma wall, and major moving average resistance. If it breaks $205 with strength, we could see a swift rally toward $215–$225, where the next Fib levels and gamma zones align.
Right now, the setup is compression under pressure. Watching for a clean breakout with confirmation.
Apple has been the last laggard among the Magnificent 7. While others have already reclaimed their weekly 20 MA,
The $205 level is the key battleground. It lines up with the .382 Fibonacci retracement from the previous high and acts as a psychological level and gamma pin. Today’s rejection at $205 reinforces its importance. If broken with volume, it could trigger a strong directional move as delta hedging unwinds into upside momentum.
🔍 Technical Outlook:
.382 Fib retracement = $205 → major inflection level
Weekly 20 MA sits just above; price compressing underneath
Bollinger Bands tightening → volatility expansion expected
MACD (weekly) flattening near a bullish cross
CMO rising, showing improving momentum under the surface
📊 Options Flow – 14-Day Snapshot:
Call Volume: $7.87M
Put Volume: $5.37M
→ Volume favors calls
Call Premium: $2.34B
Put Premium: $5.11B
→ Premium skewed toward puts, suggesting larger capital flows hedging downside or playing defense
Open Interest Cluster: Dense between $195–$300, particularly on the call side
Despite the put premium dominance, the consistent call volume and broad OI range suggest accumulation and potential bullish positioning under the surface.
🧭 Trade Thesis:
Apple is coiling at a critical intersection — Fib level, gamma wall, and major moving average resistance. If it breaks $205 with strength, we could see a swift rally toward $215–$225, where the next Fib levels and gamma zones align.
Right now, the setup is compression under pressure. Watching for a clean breakout with confirmation.
Trade active
🍏 Not financial advice
This is a continuation of my earlier thesis — Apple (
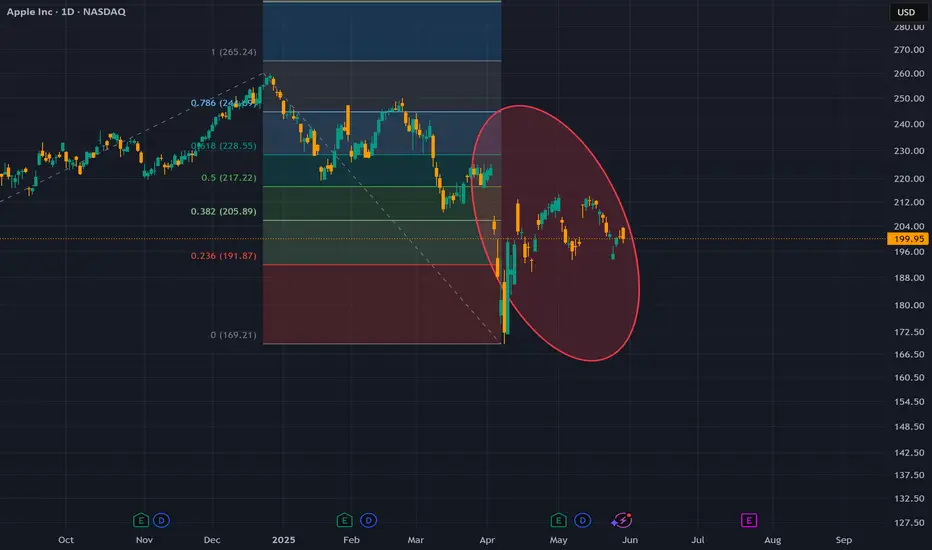
📐 Chart Breakdown (Fib Fan + Fib Retracement)
This chart uses a Fibonacci fan from the Jan 2023 low to the 2024 high, with a Fib retracement overlay on the most recent April–May correction.
Key price zones:
🔵 0.618 Fan → Support that held May’s bottom
🟢 0.5 Fan → Midpoint of consolidation zone
🟠 0.382 Fan & Fib Retracement → ~$205.89, the breakout trigger
Since the week of May 20th, price has stayed inside that candle’s range. This is classic coiling behavior beneath resistance.
🔥 Gamma Pressure (via Unusual Whales)
We continue to see gamma compression centered around the $205 strike, with the latest GEX data showing:
$205 Call GEX: +248.96K
$205 Put GEX: -181.02K
Net GEX: +67.94K
This setup reflects a neutral gamma zone with a tilt toward potential upside fuel. A break above $205 could trigger dealer hedging flows, adding thrust to price action.
🧠 Delta Exposure Shift (Specific Breakdown)
Last week: heavy put positioning concentrated between delta 81–100, indicating high-conviction downside bets
Today: only 12% of puts sit in that 81–100 delta range
→ the rest are now farther OTM, meaning reduced probability of payoff and lower hedging impact
✔ This supports the long thesis: large bearish players have reduced risk, positioning is less aggressive, and delta pressure on the downside has cooled off.
📊 Flow Metrics Recap (7-Day View):
Call Volume: 3.79M
Put Volume: 2.64M
Call Premium: $1.26B
Put Premium: $3.18B
Intraday P/C Ratio: Sub-1.0 during high-volume intervals (e.g., June 3rd 11:30 AM–Noon)
Despite premium skew toward puts, the tape shows buyers stepping in via call volume bursts. Intraday sentiment is favoring upside.
🧭 Summary
Price remains coiled under .382 confluence — Fib + Gamma
Structure remains unbroken, anchored by the May 20th range
Option delta shift and GEX show bearish unwinding + potential upside fuel
Watching closely for a weekly close above $205.89 — that’s the level that can shift everything.
Still HOLDINGGG!
Disclaimer
The information and publications are not meant to be, and do not constitute, financial, investment, trading, or other types of advice or recommendations supplied or endorsed by TradingView. Read more in the Terms of Use.
Disclaimer
The information and publications are not meant to be, and do not constitute, financial, investment, trading, or other types of advice or recommendations supplied or endorsed by TradingView. Read more in the Terms of Use.