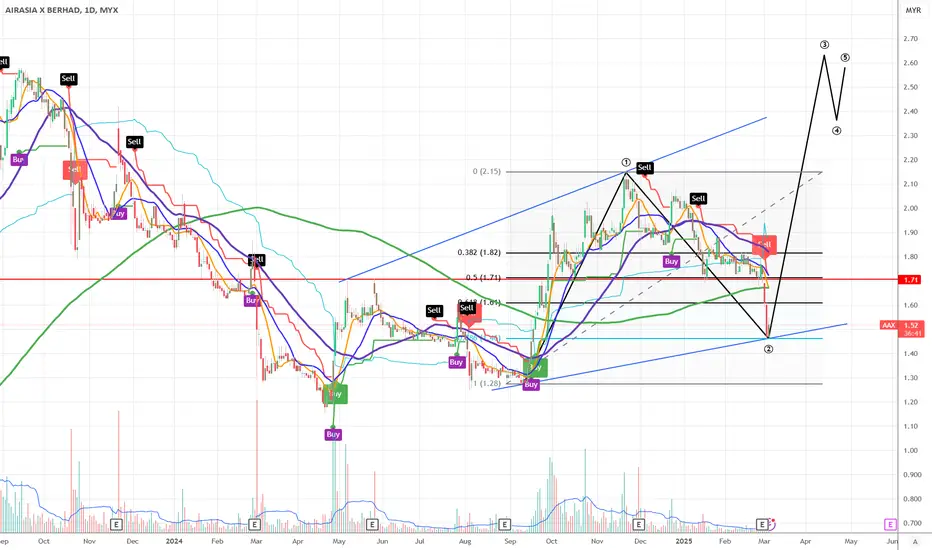
wave 2 and it retraces to 0.786, quite deep retracement
provides excellent risk and reward ratio
the wave will be invalid if current price managed to break support of rm1.28
Current price around 1.52-1.53 MYR with sell/buy buttons visible
Multiple buy and sell signals marked throughout the chart
A downward trend followed by consolidation and potential reversal pattern
Support and resistance levels marked (including 1.71 level)
Elliott Wave counting visible with numbered points (1-5)
Moving averages (multiple colored lines) showing trend direction
Volume indicators at the bottom of the chart
Time frame appears to be 1-day (1D) chart showing data from 2023-2025
The chart suggests analysts are projecting a potential upward movement after the current price consolidation, with targets marked significantly higher than current levels. Recent price action shows the stock is trading near support levels after a period of decline.
Disclaimer
The information and publications are not meant to be, and do not constitute, financial, investment, trading, or other types of advice or recommendations supplied or endorsed by TradingView. Read more in the Terms of Use.
Disclaimer
The information and publications are not meant to be, and do not constitute, financial, investment, trading, or other types of advice or recommendations supplied or endorsed by TradingView. Read more in the Terms of Use.