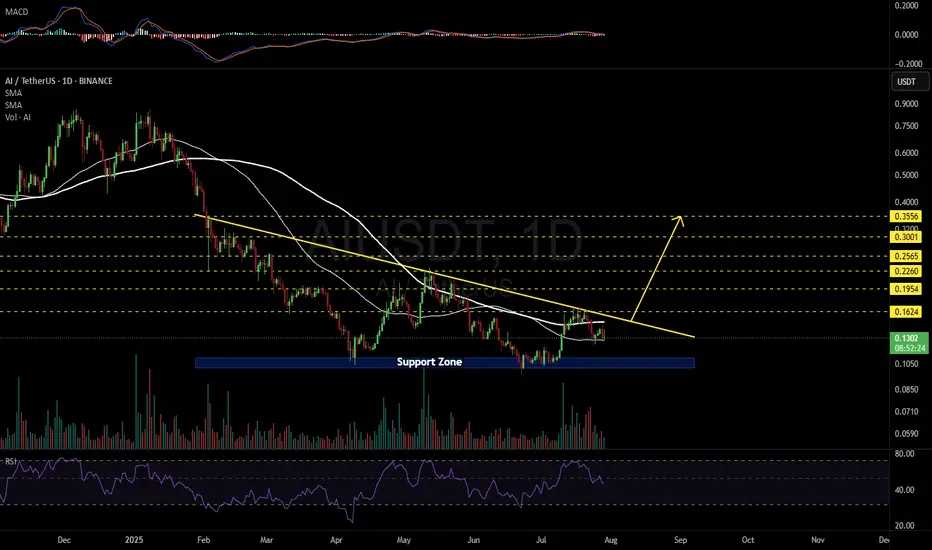
#AI is moving inside a descending triangle pattern on the daily chart and is currently holding above the daily SMA50.
📌 Consider buying at the current level and again near the support zone if the SMA50 is lost and a daily candle closes below it.
In case of a breakout above the triangle resistance and the daily SMA100, the potential upside targets are:
🎯 $0.1624
🎯 $0.1954
🎯 $0.2260
🎯 $0.2565
🎯 $0.3001
🎯 $0.3556
⚠️ As always, use a tight stop-loss and apply proper risk management.
Disclaimer
The information and publications are not meant to be, and do not constitute, financial, investment, trading, or other types of advice or recommendations supplied or endorsed by TradingView. Read more in the Terms of Use.
Disclaimer
The information and publications are not meant to be, and do not constitute, financial, investment, trading, or other types of advice or recommendations supplied or endorsed by TradingView. Read more in the Terms of Use.