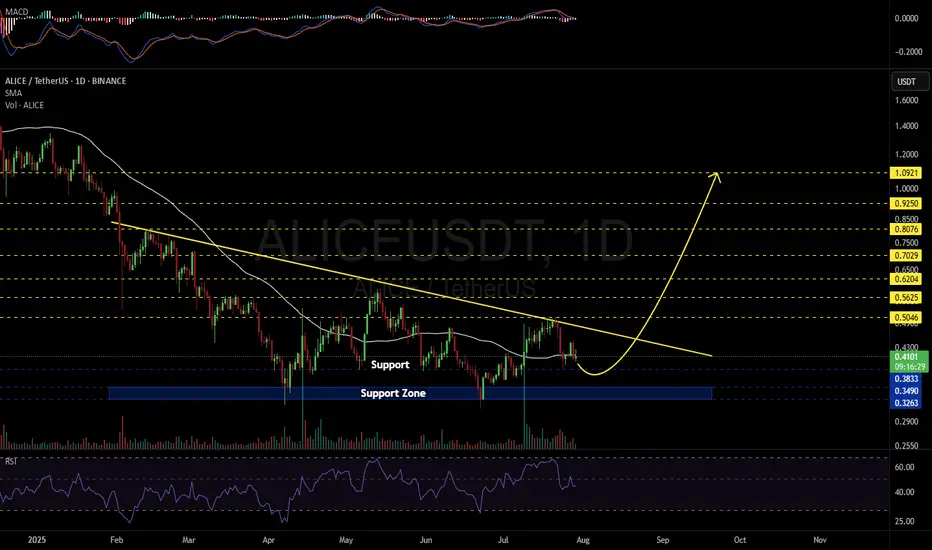
#ALICE is moving inside a descending triangle on the daily chart. It’s currently trading below the moving averages, and the RSI suggests the potential for a retest of the $0.3833 support level or even the broader support zone marked on the chart.
📌 The best areas to place buy orders are near these key support levels:
🔹$0.3833
🔹$0.3490
🔹$0.3263
In case of a breakout above the triangle resistance, the potential upside targets are:
🎯 $0.5046
🎯 $0.5625
🎯 $0.6204
🎯 $0.7029
🎯 $0.8076
🎯 $0.9250
🎯 $1.0921
⚠️ As always, use a tight stop-loss and apply proper risk management.
Disclaimer
The information and publications are not meant to be, and do not constitute, financial, investment, trading, or other types of advice or recommendations supplied or endorsed by TradingView. Read more in the Terms of Use.
Disclaimer
The information and publications are not meant to be, and do not constitute, financial, investment, trading, or other types of advice or recommendations supplied or endorsed by TradingView. Read more in the Terms of Use.