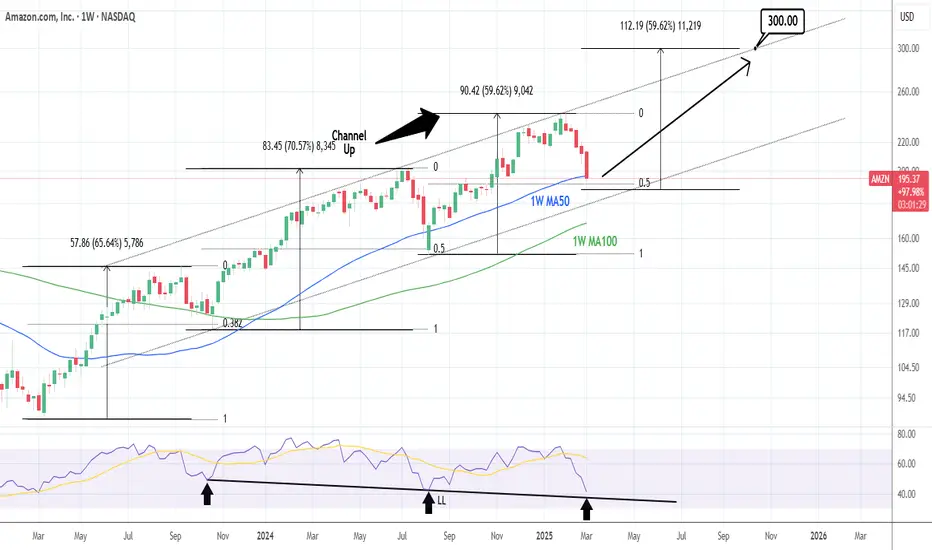
Amazon is oversold on its 1D technical outlook (RSI = 27.320, MACD = -7.090, ADX = 63.698) and this is best displayed on the 1W timeframe where the price hit this week its 1W MA50 for the first time in 7 months. The decline since the January top is technically the bearish wave of Amazon's 2 year Channel Up. The previous HL was priced on the 0.5 Fibonacci level and the one before on the 0.382. We are now just over the 0.5 Fib again, while the 1W RSI is about to hit its LL trendline. All those form massive support levels for the stock, which translate into the best buy opportunity since the early August 2024 bottom. We are expecting a similar +59.62 bullish wave to begin. The trade is long, TP = 300.
## If you like our free content follow our profile to get more daily ideas. ##
## Comments and likes are greatly appreciated. ##
## If you like our free content follow our profile to get more daily ideas. ##
## Comments and likes are greatly appreciated. ##
Telegram: t.me/investingscope
investingscope.com
Over 65% accuracy on Private Signals Channel.
Over 15% return monthly on our Account Management Plan.
Account RECOVERY services.
Free Channel: t.me/investingscopeofficial
investingscope.com
Over 65% accuracy on Private Signals Channel.
Over 15% return monthly on our Account Management Plan.
Account RECOVERY services.
Free Channel: t.me/investingscopeofficial
Disclaimer
The information and publications are not meant to be, and do not constitute, financial, investment, trading, or other types of advice or recommendations supplied or endorsed by TradingView. Read more in the Terms of Use.