🧠 Analysis Overview:
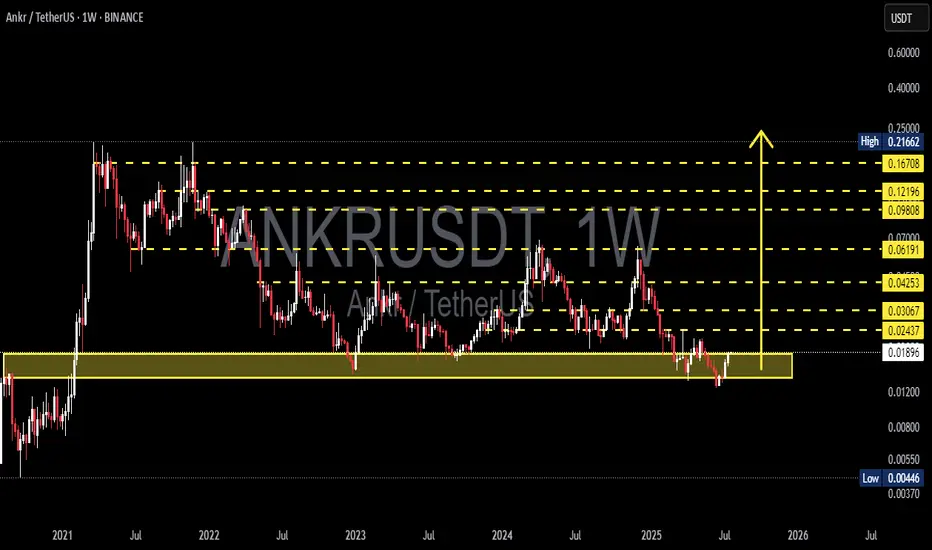
ANKR is showing strong signs of a potential macro reversal after bouncing off its historical demand zone around 0.017–0.019 USDT. This zone has proven to be a significant accumulation area in past cycles — fueling major rallies in both 2021 and 2023. The recent reaction at this level could mark the beginning of a substantial bullish leg in the mid-to-long term.
🔍 Pattern & Structure Breakdown:
✅ Demand Zone Re-Tested:
This zone has been tested multiple times over the years and continues to attract buying interest, signaling institutional accumulation.
✅ Potential Weekly Double Bottom:
Price has formed a clear double bottom with a strong bullish rejection candle, indicating buyers are stepping back in.
✅ Macro Accumulation Range:
For nearly two years, ANKR has been ranging between 0.018 – 0.21 USDT. It’s currently at the bottom of that range, providing a high risk-reward opportunity.
✅ Fibonacci Extension Targets:
Well-defined horizontal resistances (in yellow) suggest clear roadmap targets for bullish continuation — ranging from 0.024 to 0.216.
🚀 Bullish Scenario (HIGH PROBABILITY SETUP):
Ideal Entry Zone: 0.018–0.020 USDT
Initial Breakout Confirmation: Above 0.02437
Progressive Targets:
0.03067 – minor resistance
0.04253 – previous swing high
0.06191 – historical supply
0.09808 – 0.12196 – prior distribution zone
0.16708 – 0.21662 – cycle top targets
🎯 Potential Upside: 200% – 1000%+
📈 Trend Reversal Confirmed: Once weekly higher-highs are established
⚠️ Bearish Scenario (RISK MANAGEMENT):
Breakdown below 0.01800 could trigger:
0.01200 (intermediate support)
0.00700 – 0.00446 (macro-level supports)
❗️Bearish Bias Valid: On weekly close below 0.01700 with strong selling volume
🧭 Conclusion:
> ANKR is currently at a critical macro support zone with a technically sound reversal setup.
For swing traders and mid-term investors, this is a strategic area to monitor for potential trend shift.
Tight risk, massive reward.
📌 Strategy Recommendation:
Use DCA (dollar-cost averaging) in the demand zone
Place conservative stop-loss below 0.01700
Watch for breakout with volume above 0.02437 to confirm bullish reversal
#ANKR #ANKRUSDT #CryptoReversal #AltcoinSetup #WeeklyChart #SwingTrade #AccumulationZone #TechnicalAnalysis #LowCapAltcoin #FibonacciTargets
✅ Get Free Signals! Join Our Telegram Channel Here: t.me/TheCryptoNuclear
✅ Twitter: twitter.com/crypto_nuclear
✅ Join Bybit : partner.bybit.com/b/nuclearvip
✅ Benefits : Lifetime Trading Fee Discount -50%
✅ Twitter: twitter.com/crypto_nuclear
✅ Join Bybit : partner.bybit.com/b/nuclearvip
✅ Benefits : Lifetime Trading Fee Discount -50%
Disclaimer
The information and publications are not meant to be, and do not constitute, financial, investment, trading, or other types of advice or recommendations supplied or endorsed by TradingView. Read more in the Terms of Use.