$APUUSDT – Wyckoff Accumulation Pattern (3D Chart)
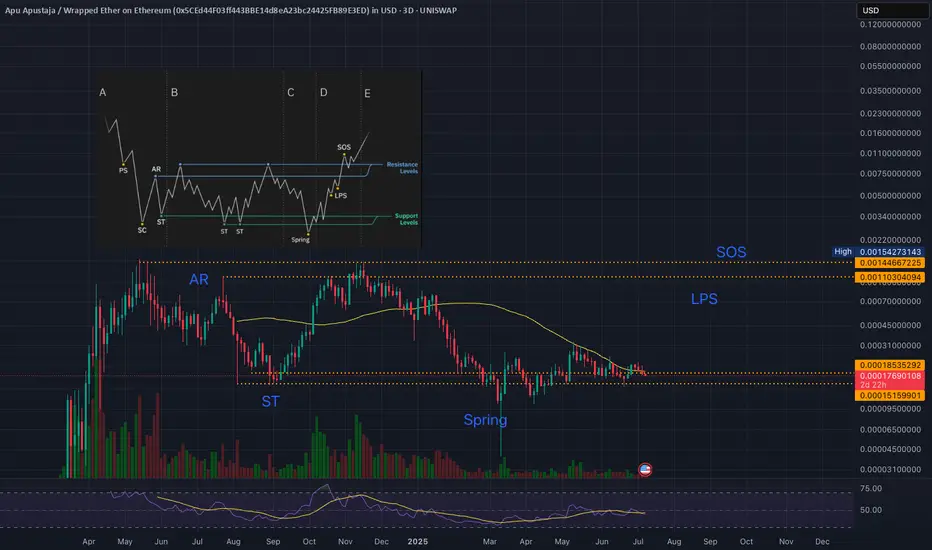
The current structure of AAPU on the 3D timeframe is closely following the classic Wyckoff Accumulation Schematic #1, suggesting a potential major breakout phase might be approaching. Here's the breakdown:
🔍 Wyckoff Phases Identified:
PS (Preliminary Support): Initial buying interest appeared as price declined rapidly.
SC (Selling Climax): Panic selling ended with a strong reaction, forming the bottom.
AR (Automatic Rally): A sharp move up, defining the upper boundary of the trading range.
ST (Secondary Test): Price retested the SC zone, confirming support.
Spring: A shakeout below support, designed to trap bears and absorb supply — we saw this in early 2025.
LPS (Last Point of Support): Price begins to form higher lows with declining volume — currently happening.
SOS (Sign of Strength): Anticipated next phase if breakout above resistance occurs.
🔸 Current Market Context:
Price has completed the Spring phase, bouncing back into the range.
Volume has decreased, consistent with absorption of supply.
A higher low structure is developing post-Spring, indicating demand is increasing.
Real-Time Market Cap: ~$59M USD — still relatively low and suggests room for growth.
Moving averages are flattening out, possibly prepping for a bullish crossover.
🔼 Target Zones (Based on Market Cap):
$0.00296 (MC 1B) 📈
$0.00888 (MC 3B) 🔥
$0.0296 (MC 10B) 🚀
$0.05919 (MC 20B) 🧨
These levels correspond to realistic potential moves if market participation continues and we transition into a full Markup Phase.
📊 Summary:
AAPU appears to be completing its accumulation phase and might be setting up for a Sign of Strength (SOS) soon. A breakout above the LPS zone (~0.0005 USD) with strong volume would confirm entry into Phase E. Keep an eye on volume spikes and price action around the 0.0011–0.0014 USD resistance area.
🔔 Not financial advice – DYOR always.
Let me know your thoughts below or if you see the same Wyckoff structure playing out.
#APU #Wyckoff #Altcoin #CryptoAnalysis #Accumulation #Ethereum #Uniswap #TradingView
Disclaimer
The information and publications are not meant to be, and do not constitute, financial, investment, trading, or other types of advice or recommendations supplied or endorsed by TradingView. Read more in the Terms of Use.
Disclaimer
The information and publications are not meant to be, and do not constitute, financial, investment, trading, or other types of advice or recommendations supplied or endorsed by TradingView. Read more in the Terms of Use.