Smart Money Concepts (SMC) with Fair Value Gap (FVG), Fibonacci retracement, and trendline breakout
Key Components in the Analysis:
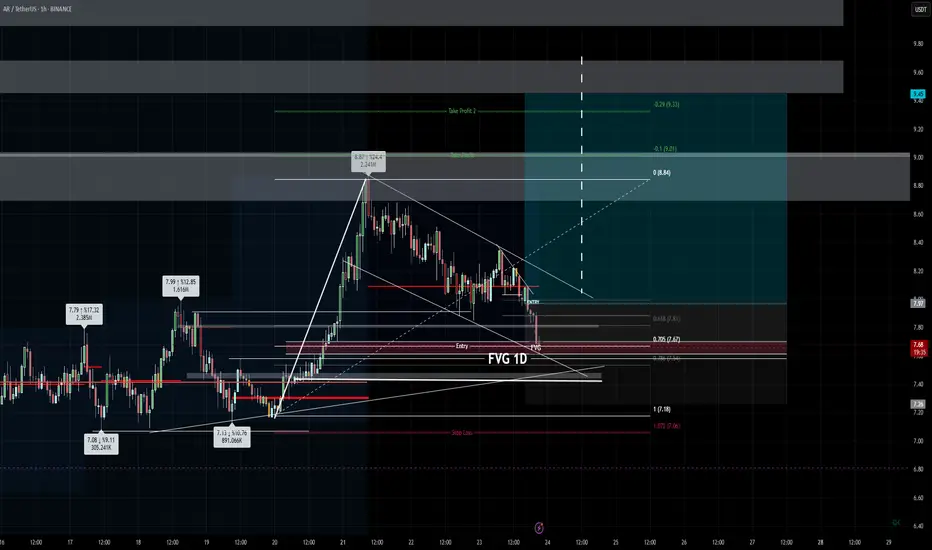
1. Fair Value Gap (FVG 1D) Zone:
Marked near the 7.18–7.67 USDT area.
This is a daily FVG acting as a liquidity and re-entry zone.
The price retraced into this gap and reacted, suggesting a potential institutional buy interest.
2. Entry Level:
The current candle shows a bullish reaction from the lower FVG zone (around 7.67).
Entry is placed just above the FVG, likely confirming reactive demand or bullish breaker structure.
3. Fibonacci Confluence:
Price bounced near the 0.705 (7.67) Fib level, with the 0.618 (7.81) also nearby.
This strengthens the bullish confluence.
4. Bullish Flag / Falling Wedge Structure:
A clear falling wedge pattern is forming after a strong bullish impulse leg.
Price is breaking out of the upper wedge trendline = bullish breakout signal.
5. Target Levels:
Take Profit 1 (TP1): Around 8.84 USDT — aligns with previous order block and imbalance zone.
Take Profit 2 (TP2): Around 9.33 USDT — targeting full extension of the bullish leg or next liquidity sweep.
6. Stop Loss:
Marked below the FVG around 7.06 USDT.
Placed just under key support to protect the trade from invalidation.
⚖️ Risk-Reward Ratio (RRR):
Approx. Risk: ~0.61 USD (7.67 entry - 7.06 SL)
Reward to TP1: ~1.17 USD (8.84 - 7.67) = ~1.91R
Reward to TP2: ~1.66 USD (9.33 - 7.67) = ~2.7R
This setup is a high-probability bullish trade based on:
Price reaction at FVG
Fib retracement confluence
Breakout from falling wedge
Clean risk-reward structure with institutional order flow
If the current 1H candle confirms bullish pressure, the trade has good odds of playing out toward the 9.33 zone, barring any macro sell-off.
Key Components in the Analysis:
1. Fair Value Gap (FVG 1D) Zone:
Marked near the 7.18–7.67 USDT area.
This is a daily FVG acting as a liquidity and re-entry zone.
The price retraced into this gap and reacted, suggesting a potential institutional buy interest.
2. Entry Level:
The current candle shows a bullish reaction from the lower FVG zone (around 7.67).
Entry is placed just above the FVG, likely confirming reactive demand or bullish breaker structure.
3. Fibonacci Confluence:
Price bounced near the 0.705 (7.67) Fib level, with the 0.618 (7.81) also nearby.
This strengthens the bullish confluence.
4. Bullish Flag / Falling Wedge Structure:
A clear falling wedge pattern is forming after a strong bullish impulse leg.
Price is breaking out of the upper wedge trendline = bullish breakout signal.
5. Target Levels:
Take Profit 1 (TP1): Around 8.84 USDT — aligns with previous order block and imbalance zone.
Take Profit 2 (TP2): Around 9.33 USDT — targeting full extension of the bullish leg or next liquidity sweep.
6. Stop Loss:
Marked below the FVG around 7.06 USDT.
Placed just under key support to protect the trade from invalidation.
⚖️ Risk-Reward Ratio (RRR):
Approx. Risk: ~0.61 USD (7.67 entry - 7.06 SL)
Reward to TP1: ~1.17 USD (8.84 - 7.67) = ~1.91R
Reward to TP2: ~1.66 USD (9.33 - 7.67) = ~2.7R
This setup is a high-probability bullish trade based on:
Price reaction at FVG
Fib retracement confluence
Breakout from falling wedge
Clean risk-reward structure with institutional order flow
If the current 1H candle confirms bullish pressure, the trade has good odds of playing out toward the 9.33 zone, barring any macro sell-off.
Disclaimer
The information and publications are not meant to be, and do not constitute, financial, investment, trading, or other types of advice or recommendations supplied or endorsed by TradingView. Read more in the Terms of Use.
Disclaimer
The information and publications are not meant to be, and do not constitute, financial, investment, trading, or other types of advice or recommendations supplied or endorsed by TradingView. Read more in the Terms of Use.