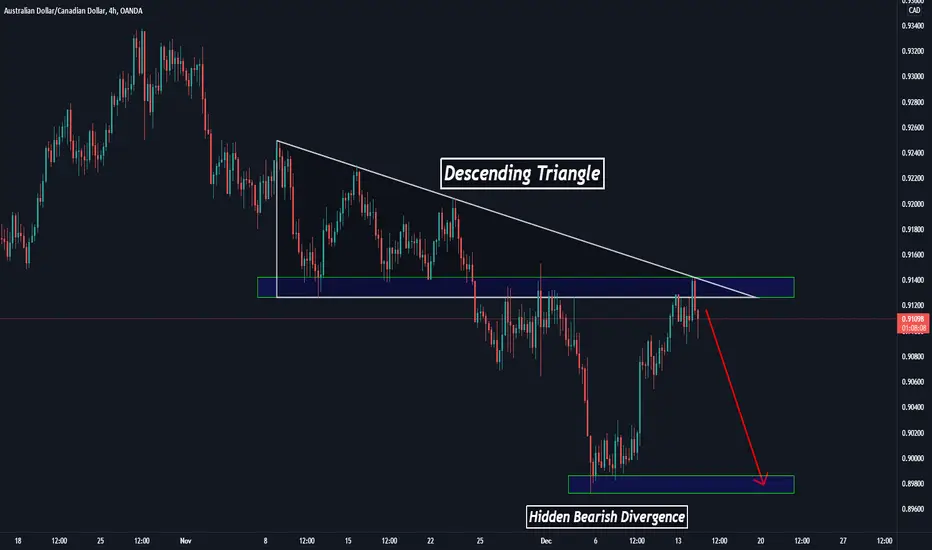
SHORT trade analysis on AUDCAD.
Graph is looking bearish from resistance area - recent Lower High. Price completed Descending Triangle Pattern as well, which signalizes bearish continuation. Bearish Engulfing Candle also indicates sell on the chart. On the last Lower High is seen Hidden Bearish Divergence with potential another drop. Trade idea is also shown on RSI indicator.
If you liked this idea or if you have your own opinion about it, feel free to write in the comments.
Disclaimer
The information and publications are not meant to be, and do not constitute, financial, investment, trading, or other types of advice or recommendations supplied or endorsed by TradingView. Read more in the Terms of Use.
Disclaimer
The information and publications are not meant to be, and do not constitute, financial, investment, trading, or other types of advice or recommendations supplied or endorsed by TradingView. Read more in the Terms of Use.