📉 Overview from Weekly Time Frame
AUDCHF has been held under the 14EMA and a significant weekly resistance zone for multiple weeks, mirroring the bearish control seen in NZDCHF. Sellers have maintained dominance without a successful bullish close above the EMA, reinforcing a bearish long-term bias.
📆 Daily Chart Explanation
The daily timeframe shows a clear internal structure break to the downside. Price has decisively dropped below both the 14EMA and 50EMA, confirming bearish momentum and trend shift. This setup adds confidence to look for sell continuation setups.
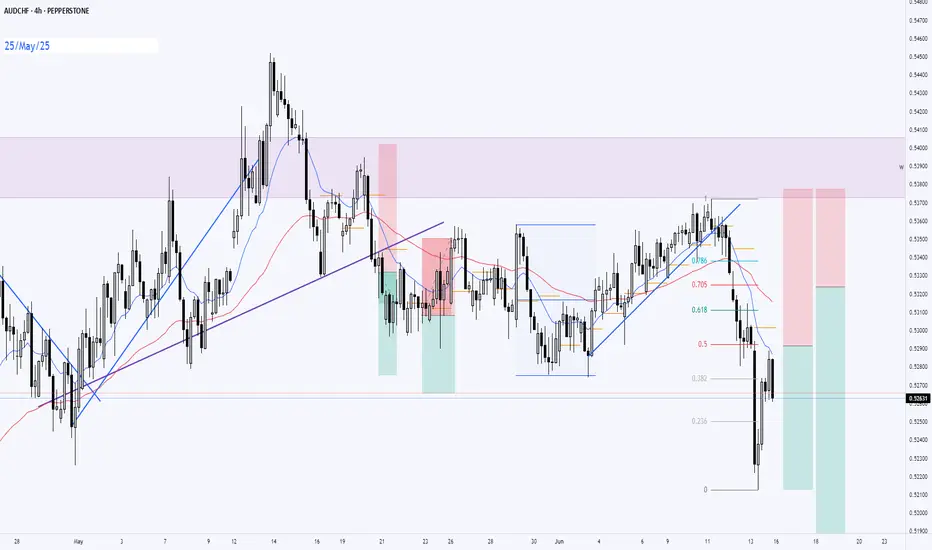
⏱ 4H Chart Explanation
4H chart aligns with the higher timeframes. A bearish trendline has been broken and structure has shifted lower, with price making lower highs and lower lows. Momentum is clearly favoring sellers, especially after the EMA50 breakdown.
🧭 Plan
Bias: Bearish
Entry: Wait for price to pull back into the discounted zone near broken structure or EMA confluence on 4H, with bearish confirmation
Targets:
• TP1 – Recent low
• TP2 – Next key support level on daily timeframe
Invalidation: A break and close above the 4H structure high or 50EMA would invalidate the setup
AUDCHF has been held under the 14EMA and a significant weekly resistance zone for multiple weeks, mirroring the bearish control seen in NZDCHF. Sellers have maintained dominance without a successful bullish close above the EMA, reinforcing a bearish long-term bias.
📆 Daily Chart Explanation
The daily timeframe shows a clear internal structure break to the downside. Price has decisively dropped below both the 14EMA and 50EMA, confirming bearish momentum and trend shift. This setup adds confidence to look for sell continuation setups.
⏱ 4H Chart Explanation
4H chart aligns with the higher timeframes. A bearish trendline has been broken and structure has shifted lower, with price making lower highs and lower lows. Momentum is clearly favoring sellers, especially after the EMA50 breakdown.
🧭 Plan
Bias: Bearish
Entry: Wait for price to pull back into the discounted zone near broken structure or EMA confluence on 4H, with bearish confirmation
Targets:
• TP1 – Recent low
• TP2 – Next key support level on daily timeframe
Invalidation: A break and close above the 4H structure high or 50EMA would invalidate the setup
Note
Both entry triggered.Disclaimer
The information and publications are not meant to be, and do not constitute, financial, investment, trading, or other types of advice or recommendations supplied or endorsed by TradingView. Read more in the Terms of Use.
Disclaimer
The information and publications are not meant to be, and do not constitute, financial, investment, trading, or other types of advice or recommendations supplied or endorsed by TradingView. Read more in the Terms of Use.