After rejecting an attempt to break below the November low of 0.69913 earlier this month, AUD/USD has established a short-term range of 0.70903 to 0.72237.
However, momentum might still be bearish for AUD/USD. Looking at the simple moving averages (SMA), a bearish triple moving average (TMA) formation requires the price to be below the short term SMA, the latter to be below the medium term SMA and the medium term SMA to be below the long term SMA. All SMAs also need to have a negative gradient.
All the SMAs have a negative gradient, except for the 10-day SMA. This might suggest a pause in bearishness. Additionally, the 10-day SMA could cross above the 21-day depending on where the price closes today.
Excluding the 10-day SMA, any 3 other SMAs would currently meet the criteria for a bearish TMA.
Support may lie at the recent lows of 0.70903 and 0.69932 or the November 2020 low of 0.69913.
On the topside, resistance might be at the recent high of 0.72237 or at the 55 and 100-day SMAs currently near 73 cents.
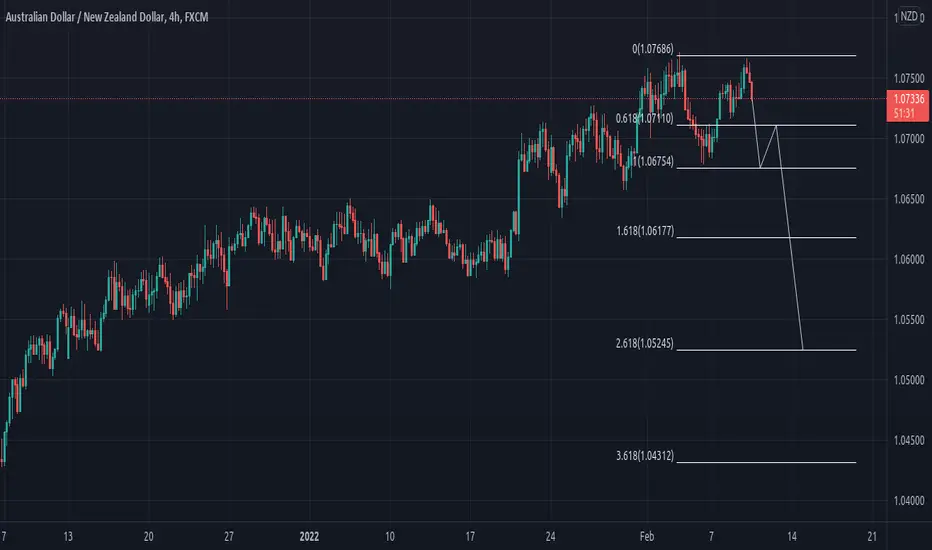
AUD/NZD has recently moved to the top end of a range that has held since July this year. The July peak of 1.06211 was tested in October with a high at 1.06118. Last week, it fell just shy again, as it traded to 1.05981. These three levels may offer resistance.
On the march higher, it struggled to break above the upper band of the 21-day SMA based Bollinger Band. This might indicate that the market is accommodative of the higher levels being seen.
On the downside, initial support could be at the 10-day SMA, currently just under 1.0540.
Further below, the pivot point at 1.05025 may provide support as it has held two recent moves toward it.
Those recent lows at 1.05037 and 1.05043 are now potential support levels as well.
However, momentum might still be bearish for AUD/USD. Looking at the simple moving averages (SMA), a bearish triple moving average (TMA) formation requires the price to be below the short term SMA, the latter to be below the medium term SMA and the medium term SMA to be below the long term SMA. All SMAs also need to have a negative gradient.
All the SMAs have a negative gradient, except for the 10-day SMA. This might suggest a pause in bearishness. Additionally, the 10-day SMA could cross above the 21-day depending on where the price closes today.
Excluding the 10-day SMA, any 3 other SMAs would currently meet the criteria for a bearish TMA.
Support may lie at the recent lows of 0.70903 and 0.69932 or the November 2020 low of 0.69913.
On the topside, resistance might be at the recent high of 0.72237 or at the 55 and 100-day SMAs currently near 73 cents.
AUD/NZD has recently moved to the top end of a range that has held since July this year. The July peak of 1.06211 was tested in October with a high at 1.06118. Last week, it fell just shy again, as it traded to 1.05981. These three levels may offer resistance.
On the march higher, it struggled to break above the upper band of the 21-day SMA based Bollinger Band. This might indicate that the market is accommodative of the higher levels being seen.
On the downside, initial support could be at the 10-day SMA, currently just under 1.0540.
Further below, the pivot point at 1.05025 may provide support as it has held two recent moves toward it.
Those recent lows at 1.05037 and 1.05043 are now potential support levels as well.
Disclaimer
The information and publications are not meant to be, and do not constitute, financial, investment, trading, or other types of advice or recommendations supplied or endorsed by TradingView. Read more in the Terms of Use.
Disclaimer
The information and publications are not meant to be, and do not constitute, financial, investment, trading, or other types of advice or recommendations supplied or endorsed by TradingView. Read more in the Terms of Use.