AUD/USD Bullish Breakout from Descending Channel Targeting 0.663
📊 AUD/USD 1H Chart Analysis
🔹 Chart Overview:
Pair: AUD/USD
Timeframe: 1-Hour (1H)
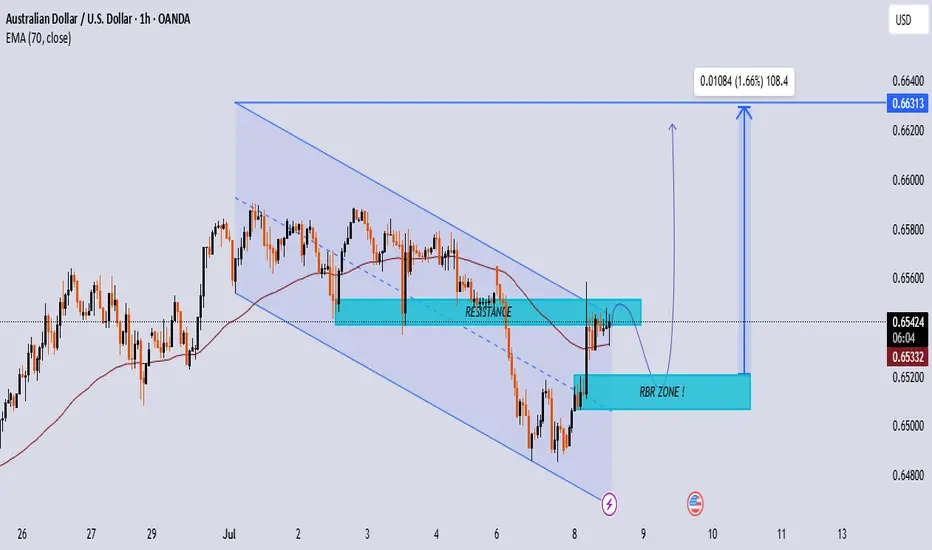
EMA 70 (red line): Acting as dynamic support/resistance
Current Price: 0.65420
Resistance Zone: Around 0.65450 – 0.65500
RBR Zone (Rally-Base-Rally): Around 0.65150 – 0.65250
Target Level: 0.66313 (Marked with an upward projection of +1.66%)
🔍 Technical Analysis:
🟦 Descending Channel (Broken):
Price was previously moving inside a downward sloping channel.
A bullish breakout is forming as price now consolidates just outside the upper boundary.
📌 Resistance Zone (0.65450–0.65500):
This area is acting as short-term resistance.
Price has paused here after a strong bullish move from the RBR zone.
🔁 RBR Demand Zone (0.65150–0.65250):
A key demand area where price previously rallied, formed a base, and rallied again.
If price retraces, this zone is expected to act as a strong support for a bounce.
📈 Projected Move:
If price holds above the RBR zone or breaks above resistance, a bullish continuation is expected.
Target is set near 0.66313, which is approximately a +1.66% move from the current level.
✅ Bullish Bias Justification:
Breakout from descending structure
Holding above EMA 70
Clear RBR demand zone identified
Bullish price action and momentum buildup
⚠️ Risk Note:
A failed breakout or strong rejection from the resistance zone could push price back into the RBR zone or even re-enter the descending channel.
Keep an eye on the next few candles for confirmation.
🔹 Chart Overview:
Pair: AUD/USD
Timeframe: 1-Hour (1H)
EMA 70 (red line): Acting as dynamic support/resistance
Current Price: 0.65420
Resistance Zone: Around 0.65450 – 0.65500
RBR Zone (Rally-Base-Rally): Around 0.65150 – 0.65250
Target Level: 0.66313 (Marked with an upward projection of +1.66%)
🔍 Technical Analysis:
🟦 Descending Channel (Broken):
Price was previously moving inside a downward sloping channel.
A bullish breakout is forming as price now consolidates just outside the upper boundary.
📌 Resistance Zone (0.65450–0.65500):
This area is acting as short-term resistance.
Price has paused here after a strong bullish move from the RBR zone.
🔁 RBR Demand Zone (0.65150–0.65250):
A key demand area where price previously rallied, formed a base, and rallied again.
If price retraces, this zone is expected to act as a strong support for a bounce.
📈 Projected Move:
If price holds above the RBR zone or breaks above resistance, a bullish continuation is expected.
Target is set near 0.66313, which is approximately a +1.66% move from the current level.
✅ Bullish Bias Justification:
Breakout from descending structure
Holding above EMA 70
Clear RBR demand zone identified
Bullish price action and momentum buildup
⚠️ Risk Note:
A failed breakout or strong rejection from the resistance zone could push price back into the RBR zone or even re-enter the descending channel.
Keep an eye on the next few candles for confirmation.
Trade active
Note
trade runing in profits enjoy you special profits with usjoin my tellegram channel
t.me/JaMesGoldFiGhteR786
join my refferal broker
one.exnesstrack.org/a/g565sj1uo7?source=app
t.me/JaMesGoldFiGhteR786
join my refferal broker
one.exnesstrack.org/a/g565sj1uo7?source=app
Disclaimer
The information and publications are not meant to be, and do not constitute, financial, investment, trading, or other types of advice or recommendations supplied or endorsed by TradingView. Read more in the Terms of Use.
join my tellegram channel
t.me/JaMesGoldFiGhteR786
join my refferal broker
one.exnesstrack.org/a/g565sj1uo7?source=app
t.me/JaMesGoldFiGhteR786
join my refferal broker
one.exnesstrack.org/a/g565sj1uo7?source=app
Disclaimer
The information and publications are not meant to be, and do not constitute, financial, investment, trading, or other types of advice or recommendations supplied or endorsed by TradingView. Read more in the Terms of Use.