Technical Summary:
Elliott Wave Structure:
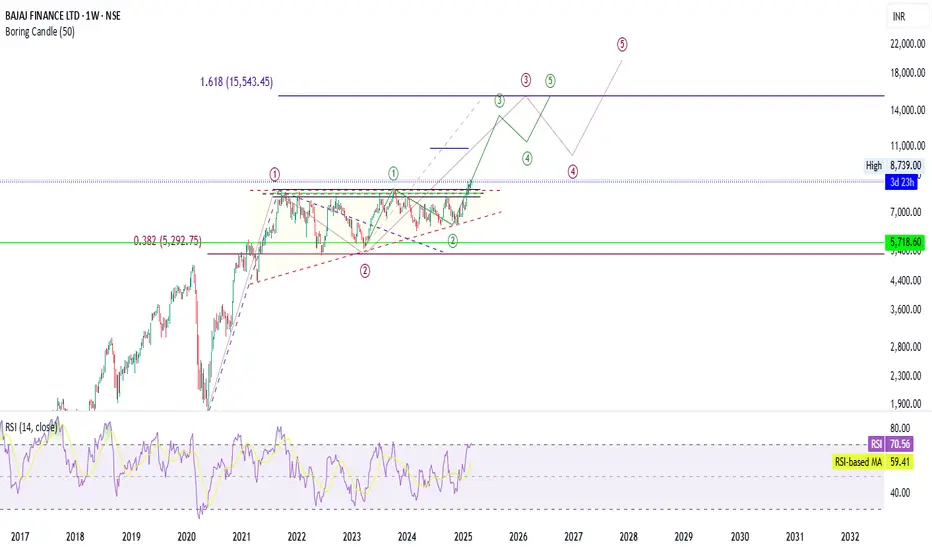
The chart suggests an ongoing impulse wave (Wave 3 in green) after completing Wave 2 correction.
Future projections indicate the completion of Wave 5 around 15,543 as a 1.618 Fibonacci extension.
Support & Resistance Levels:
Strong Support:
5,718.60 (highlighted in green) – a crucial support area.
5,292.75 (Fibonacci 38.2% retracement) – historical support level.
Resistance:
8,739 (current high) – breaking above this could confirm a bullish continuation.
15,543 (Wave 5 target) – major long-term price target.
RSI Analysis:
RSI at 70.56, near overbought territory.
RSI-based moving average at 59.41, indicating strong momentum.
Key Observations & Potential Risks:
✅ Bullish Scenario:
If price sustains above 8,739, the next major move could lead towards 15,543.
Strong wave structure confirms long-term bullish potential.
❌ Bearish Risk:
If price fails to hold above 8,739, a correction toward 5,718 – 5,292 levels is possible.
RSI in overbought territory suggests a potential short-term pullback before further upward movement.
Recommendations & Strategy:
Monitor breakout confirmation above 8,739 for further upside.
Be cautious of a short-term pullback, especially if RSI starts declining.
Long-term investors can hold positions, while traders may wait for a retracement entry near 7,500 – 6,500.
Elliott Wave Structure:
The chart suggests an ongoing impulse wave (Wave 3 in green) after completing Wave 2 correction.
Future projections indicate the completion of Wave 5 around 15,543 as a 1.618 Fibonacci extension.
Support & Resistance Levels:
Strong Support:
5,718.60 (highlighted in green) – a crucial support area.
5,292.75 (Fibonacci 38.2% retracement) – historical support level.
Resistance:
8,739 (current high) – breaking above this could confirm a bullish continuation.
15,543 (Wave 5 target) – major long-term price target.
RSI Analysis:
RSI at 70.56, near overbought territory.
RSI-based moving average at 59.41, indicating strong momentum.
Key Observations & Potential Risks:
✅ Bullish Scenario:
If price sustains above 8,739, the next major move could lead towards 15,543.
Strong wave structure confirms long-term bullish potential.
❌ Bearish Risk:
If price fails to hold above 8,739, a correction toward 5,718 – 5,292 levels is possible.
RSI in overbought territory suggests a potential short-term pullback before further upward movement.
Recommendations & Strategy:
Monitor breakout confirmation above 8,739 for further upside.
Be cautious of a short-term pullback, especially if RSI starts declining.
Long-term investors can hold positions, while traders may wait for a retracement entry near 7,500 – 6,500.
Disclaimer
The information and publications are not meant to be, and do not constitute, financial, investment, trading, or other types of advice or recommendations supplied or endorsed by TradingView. Read more in the Terms of Use.
Disclaimer
The information and publications are not meant to be, and do not constitute, financial, investment, trading, or other types of advice or recommendations supplied or endorsed by TradingView. Read more in the Terms of Use.