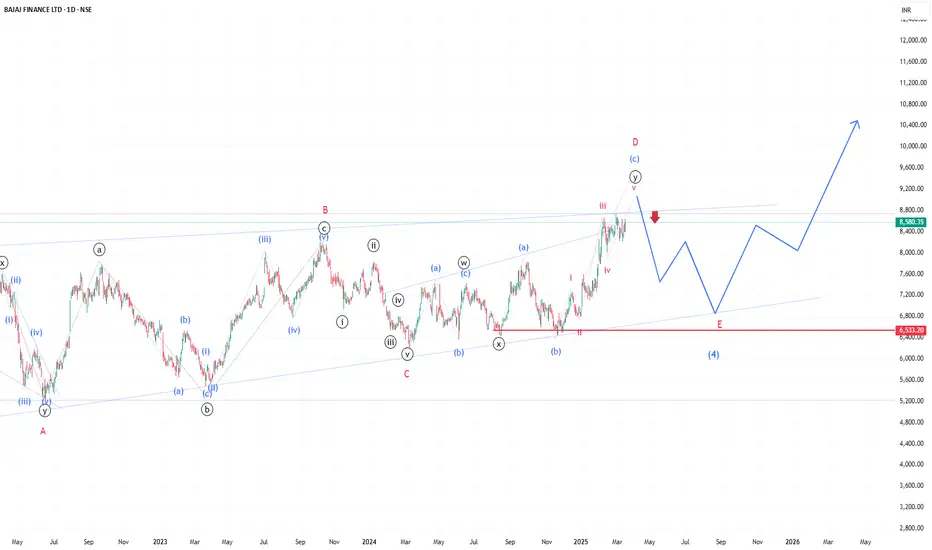
🔹 Key Observations:
✅ Triangle Formation: Price action is consolidating within a contracting structure.
✅ Wave (d) Completion? Price has touched the upper boundary, signaling a possible correction.
✅ Wave (e) Drop? A move towards ₹6,533 would complete the correction before a bullish leg up.
✅ Upside Target: A breakout from the triangle could lead to a strong rally beyond ₹9,000.
🔹 Strategy:
📉 Short-term: Watching for a potential dip towards Wave (e) for a buying opportunity.
📈 Long-term: Bullish bias remains intact if the structure holds.
🚨 Disclaimer: This is my personal analysis, and I may be completely wrong. This is for educational purposes only and should not be considered financial advice. Please conduct your own research before making any trading decisions. I am not a SEBI-registered analyst.
Disclaimer
The information and publications are not meant to be, and do not constitute, financial, investment, trading, or other types of advice or recommendations supplied or endorsed by TradingView. Read more in the Terms of Use.
Disclaimer
The information and publications are not meant to be, and do not constitute, financial, investment, trading, or other types of advice or recommendations supplied or endorsed by TradingView. Read more in the Terms of Use.