🔥 BANK NIFTY – Intraday Trading Plan for 19-Mar-2025
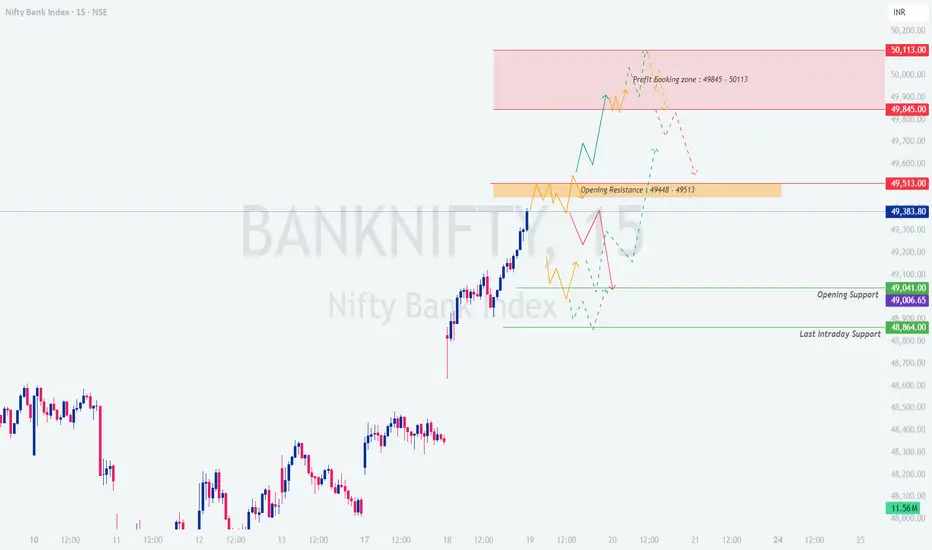
📍 CMP: 49,383.80
📊 Chart Timeframe: 15-Min
📘 Scenario 1: GAP-UP Opening (200+ points)
If BANK NIFTY opens above 49,585, it will open within or near the upper boundary of the Profit Booking Zone (49,845 – 50,113).
🧠 Educational Note: After a large gap-up, the early euphoria often fades. Wait for the first trap—either a breakout trap or breakdown trap—to reveal the true direction.
📗 Scenario 2: FLAT Opening (within 100–150 pts)
A flat to mild gap opening around 49,300 – 49,400 keeps the index close to the Opening Resistance zone: 49,448 – 49,513.
🧠 Educational Note: When the market opens flat after a trending day, expect rangebound movement early on. Let it break the opening structure before placing bets.
📙 Scenario 3: GAP-DOWN Opening (200+ points)
In case BANK NIFTY opens below 49,100, it will be around the Opening Support zone: 49,041 – 49,006 or even closer to the Last Intraday Support at 48,864.
🧠 Educational Note: Gap-downs often cause panic, but panic selling near support zones can give excellent risk-reward reversal trades. Wait for candle confirmation.
💡 Risk Management Tips for Options Traders 🛡️
✅ Use spreads (e.g., bull call or bear put spreads) to reduce risk from premium erosion.
✅ Avoid overtrading post-gap moves; trade only after structure is confirmed.
✅ Avoid buying OTM options blindly after a gap opening; they lose value fast.
✅ Follow 1:2 or better risk-reward setups. Don’t chase profits.
✅ Place stop-losses based on candle close, not ticks.
✅ Use position sizing to manage risk—don’t risk more than 1–2% of capital per trade.
✅ Don’t average losing option positions. Exit fast if view is invalidated.
📊 Summary & Conclusion
📌 Resistance Zones:
🔺 49,448 – 49,513 (Opening Resistance)
🔺 49,845 – 50,113 (Profit Booking Zone)
📌 Support Zones:
🟩 49,041 – 49,006 (Opening Support)
🟩 48,864 (Last Intraday Support)
🔄 Key Actionable Plan:
— For gap-up, wait for reversal signs in profit booking zone.
— For flat open, focus on breakout or rejection near opening resistance.
— For gap-down, look for reversal near support unless breakdown happens.
🎯 Trade the reaction, not the expectation. Let the price action unfold near key zones, and only then initiate trades with tight stop losses and proper risk reward.
⚠️ Disclaimer: I am not a SEBI registered analyst. This analysis is shared for educational purposes only. Please consult your financial advisor before making any investment or trading decisions.
📍 CMP: 49,383.80
📊 Chart Timeframe: 15-Min
📘 Scenario 1: GAP-UP Opening (200+ points)
If BANK NIFTY opens above 49,585, it will open within or near the upper boundary of the Profit Booking Zone (49,845 – 50,113).
- []Opening directly in the Profit Booking Zone usually leads to short-term exhaustion due to profit-taking from recent long positions. []Avoid aggressive long positions in the first 15 minutes; instead, monitor for reversal signs such as bearish engulfing or evening star near 49,900–50,100. []If the index forms a tight consolidation or fake breakout within the red zone, a short trade can be considered with a stop above 50,120, targeting a retest of 49,585 and possibly 49,513. []On the flip side, if price breaks above 50,113 with strong bullish volume and sustains for 15–30 minutes, a fresh uptrend may emerge. In that case, switch bias to buy-on-dips with SL below 50,000.
🧠 Educational Note: After a large gap-up, the early euphoria often fades. Wait for the first trap—either a breakout trap or breakdown trap—to reveal the true direction.
📗 Scenario 2: FLAT Opening (within 100–150 pts)
A flat to mild gap opening around 49,300 – 49,400 keeps the index close to the Opening Resistance zone: 49,448 – 49,513.
- []This area may act as a strong inflection point. Watch how price reacts in the first 15 minutes around this resistance. []If price breaks above 49,513 with volume and retests this zone successfully, it could head toward 49,845. []Conversely, if rejection happens around 49,448–49,513, short opportunities open up with targets at 49,041 and 48,864. []Do not take trades within a narrow range unless price gives a clean breakout or breakdown.
🧠 Educational Note: When the market opens flat after a trending day, expect rangebound movement early on. Let it break the opening structure before placing bets.
📙 Scenario 3: GAP-DOWN Opening (200+ points)
In case BANK NIFTY opens below 49,100, it will be around the Opening Support zone: 49,041 – 49,006 or even closer to the Last Intraday Support at 48,864.
- []Aggressive selling at open should be avoided unless price breaks below 48,864 decisively. []Look for signs of reversal around 49,006 or 48,864. If the market forms double bottom or bullish hammer with a strong follow-up candle, intraday recovery trades may work well. []Upside targets in a bounce can be 49,300 and 49,448. []If price fails to hold 48,864, expect a decline towards 48,700 – 48,550 zone. Stick to directional trades only after a 15-min candle close below key support.
🧠 Educational Note: Gap-downs often cause panic, but panic selling near support zones can give excellent risk-reward reversal trades. Wait for candle confirmation.
💡 Risk Management Tips for Options Traders 🛡️
✅ Use spreads (e.g., bull call or bear put spreads) to reduce risk from premium erosion.
✅ Avoid overtrading post-gap moves; trade only after structure is confirmed.
✅ Avoid buying OTM options blindly after a gap opening; they lose value fast.
✅ Follow 1:2 or better risk-reward setups. Don’t chase profits.
✅ Place stop-losses based on candle close, not ticks.
✅ Use position sizing to manage risk—don’t risk more than 1–2% of capital per trade.
✅ Don’t average losing option positions. Exit fast if view is invalidated.
📊 Summary & Conclusion
📌 Resistance Zones:
🔺 49,448 – 49,513 (Opening Resistance)
🔺 49,845 – 50,113 (Profit Booking Zone)
📌 Support Zones:
🟩 49,041 – 49,006 (Opening Support)
🟩 48,864 (Last Intraday Support)
🔄 Key Actionable Plan:
— For gap-up, wait for reversal signs in profit booking zone.
— For flat open, focus on breakout or rejection near opening resistance.
— For gap-down, look for reversal near support unless breakdown happens.
🎯 Trade the reaction, not the expectation. Let the price action unfold near key zones, and only then initiate trades with tight stop losses and proper risk reward.
⚠️ Disclaimer: I am not a SEBI registered analyst. This analysis is shared for educational purposes only. Please consult your financial advisor before making any investment or trading decisions.
Disclaimer
The information and publications are not meant to be, and do not constitute, financial, investment, trading, or other types of advice or recommendations supplied or endorsed by TradingView. Read more in the Terms of Use.
Disclaimer
The information and publications are not meant to be, and do not constitute, financial, investment, trading, or other types of advice or recommendations supplied or endorsed by TradingView. Read more in the Terms of Use.