Hello Traders,
Here is my chart idea for Bavarian Nordic. This idea is solely based on me looking at the chart formation and no research has been done into the companies financials, potential upcoming vaccines or anything like that.
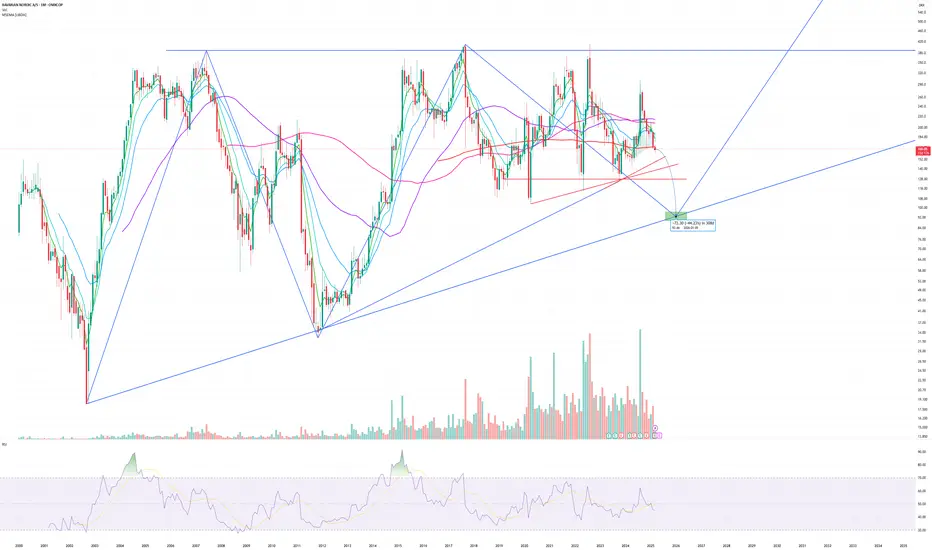
The price has been going sideways inside a large ascending triangle for about 22 years now and price movement still looks to be corrective waves not impulsive waves. It looks like the price wants to come down to the bottom trendline and bounce from there. This would also print a low, oversold value on the monthly RSI.
On the weekly chart it looks like the price has just broke down from a head and shoulders.

Lets see what happens.
Here is my chart idea for Bavarian Nordic. This idea is solely based on me looking at the chart formation and no research has been done into the companies financials, potential upcoming vaccines or anything like that.
The price has been going sideways inside a large ascending triangle for about 22 years now and price movement still looks to be corrective waves not impulsive waves. It looks like the price wants to come down to the bottom trendline and bounce from there. This would also print a low, oversold value on the monthly RSI.
On the weekly chart it looks like the price has just broke down from a head and shoulders.
Lets see what happens.
Related publications
Disclaimer
The information and publications are not meant to be, and do not constitute, financial, investment, trading, or other types of advice or recommendations supplied or endorsed by TradingView. Read more in the Terms of Use.
Related publications
Disclaimer
The information and publications are not meant to be, and do not constitute, financial, investment, trading, or other types of advice or recommendations supplied or endorsed by TradingView. Read more in the Terms of Use.