#bel  BEL
BEL
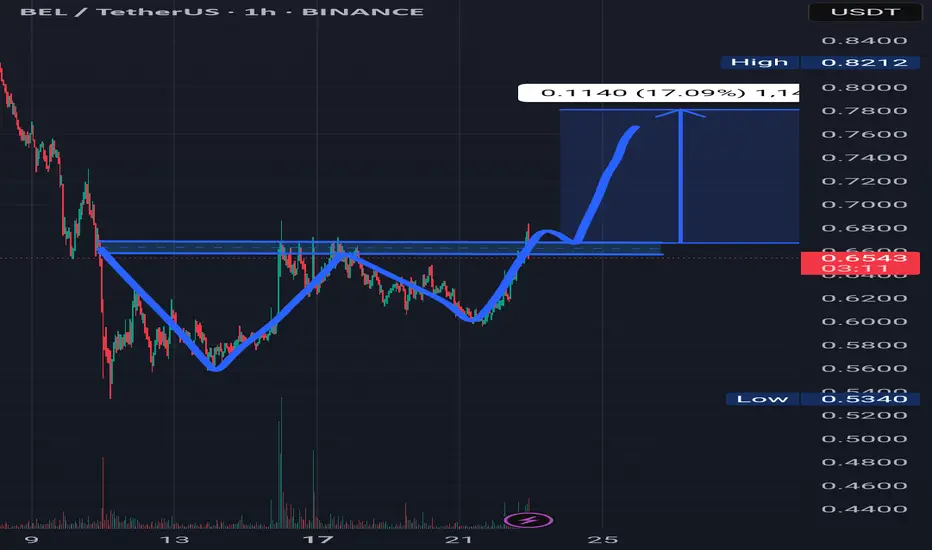
A double bottom pattern is a classical technical analysis showing a major change in trend from a prior down move.
The double bottom pattern looks like the letter "W." The twice-touched low is considered a support level.
The double bottom pattern always follows a major or minor downtrend in a particular security, and signals the reversal and the beginning of a potential uptrend.
Double bottom patterns occur relatively often and in many different timeframes.
A daily double bottom may indicate a longer-term reversal or shift in trend, while an hourly double bottom may signal only a brief pause in a down trend.
Disclaimer
The information and publications are not meant to be, and do not constitute, financial, investment, trading, or other types of advice or recommendations supplied or endorsed by TradingView. Read more in the Terms of Use.
Disclaimer
The information and publications are not meant to be, and do not constitute, financial, investment, trading, or other types of advice or recommendations supplied or endorsed by TradingView. Read more in the Terms of Use.