Simple chart:
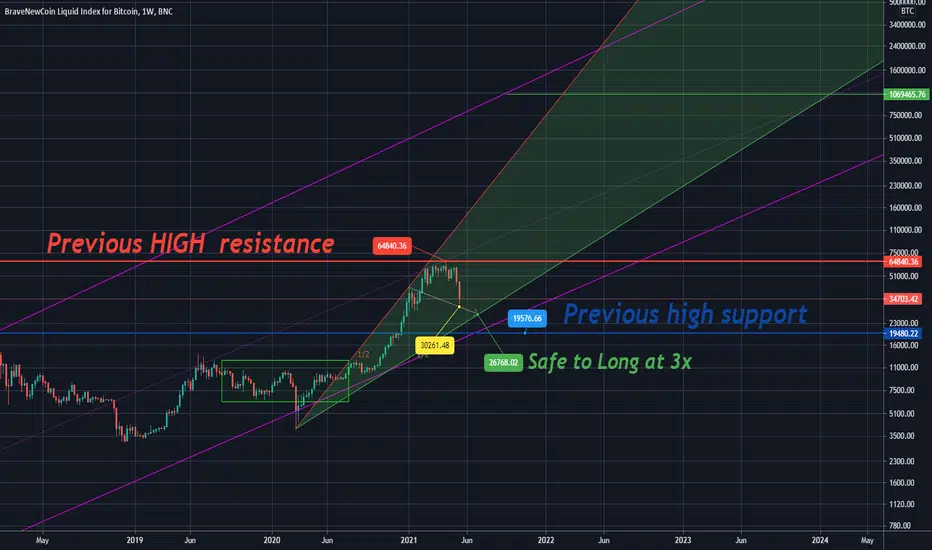
The Green are represents this Cycle Top & Cycle Bottoms.
Long when the price hits the GREEN line,
Short when the price hits the RED line
The Green are represents this Cycle Top & Cycle Bottoms.
Long when the price hits the GREEN line,
Short when the price hits the RED line
Related publications
Disclaimer
The information and publications are not meant to be, and do not constitute, financial, investment, trading, or other types of advice or recommendations supplied or endorsed by TradingView. Read more in the Terms of Use.
Related publications
Disclaimer
The information and publications are not meant to be, and do not constitute, financial, investment, trading, or other types of advice or recommendations supplied or endorsed by TradingView. Read more in the Terms of Use.