🧠 Complete and Insightful Technical Analysis:
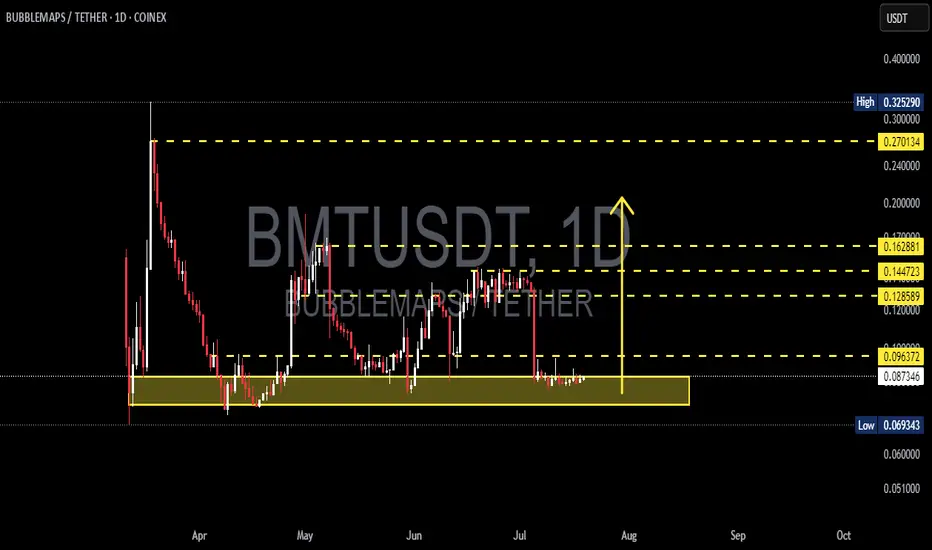
The daily chart of BMT/USDT reveals a compelling structure for traders looking to capitalize on early-stage reversals and bottom entries. The price is currently consolidating within a strong historical demand zone, ranging between $0.069 – $0.087 USDT — a level that has previously triggered multiple significant rallies (March, May, July 2025).
This isn’t just any support zone; it's a classic accumulation area, where bearish momentum appears to be fading and buyers are gradually stepping in.
🔍 Identified Chart Patterns:
✅ Accumulation Range – Sideways movement within the highlighted yellow box suggests a potential base formation.
✅ Double Bottom (W Formation) Potential – A break above resistance would confirm this bullish pattern.
✅ Wyckoff Spring Setup – If a fake breakdown below support occurs followed by a swift recovery, it could signal a powerful trend reversal.
🚀 Bullish Scenario (Reversal in Play):
If the price continues to hold above the $0.069 support, it sets the stage for a strong bullish reversal. A confirmed breakout above $0.096 with high volume would validate the bullish thesis.
📈 Upside Targets:
TP1: $0.096 USDT – Local resistance
TP2: $0.128 USDT – Previous key equilibrium zone
TP3: $0.144 - $0.162 USDT – Historical resistance
TP4: $0.270 - $0.290 USDT – Major range top
This structure provides the potential for a +200% upside move if momentum builds and resistance levels are broken sequentially.
⚠️ Bearish Scenario (Breakdown Risk):
If the price fails to hold above the demand zone and closes below $0.069, the bearish outlook takes precedence:
The next support sits at $0.063
A breakdown below this may lead to price discovery lower with strong downside pressure
👉 Caution is advised: use tight risk management if trading within this range.
🔑 Key Takeaways:
The yellow box is a critical battleground between bulls and bears.
Holding this demand zone could ignite a strong breakout.
The risk/reward setup is favorable for swing and trend traders.
A confirmed breakout could signal the start of a new bullish phase.
📊 Additional Chart Stats:
Current Price: ~$0.075 USDT
Support Zone: $0.069 - $0.087
Key Resistance Levels: $0.096 / $0.128 / $0.144 / $0.162 / $0.270
Market Structure: Sideways → Accumulation → Breakout Potential
#BMTUSDT #CryptoTrading #BreakoutSetup #WyckoffMethod #AltcoinAnalysis #SupportAndResistance #SwingTradeOpportunity #CryptoReversal
✅ Get Free Signals! Join Our Telegram Channel Here: t.me/TheCryptoNuclear
✅ Twitter: twitter.com/crypto_nuclear
✅ Join Bybit : partner.bybit.com/b/nuclearvip
✅ Benefits : Lifetime Trading Fee Discount -50%
✅ Twitter: twitter.com/crypto_nuclear
✅ Join Bybit : partner.bybit.com/b/nuclearvip
✅ Benefits : Lifetime Trading Fee Discount -50%
Disclaimer
The information and publications are not meant to be, and do not constitute, financial, investment, trading, or other types of advice or recommendations supplied or endorsed by TradingView. Read more in the Terms of Use.