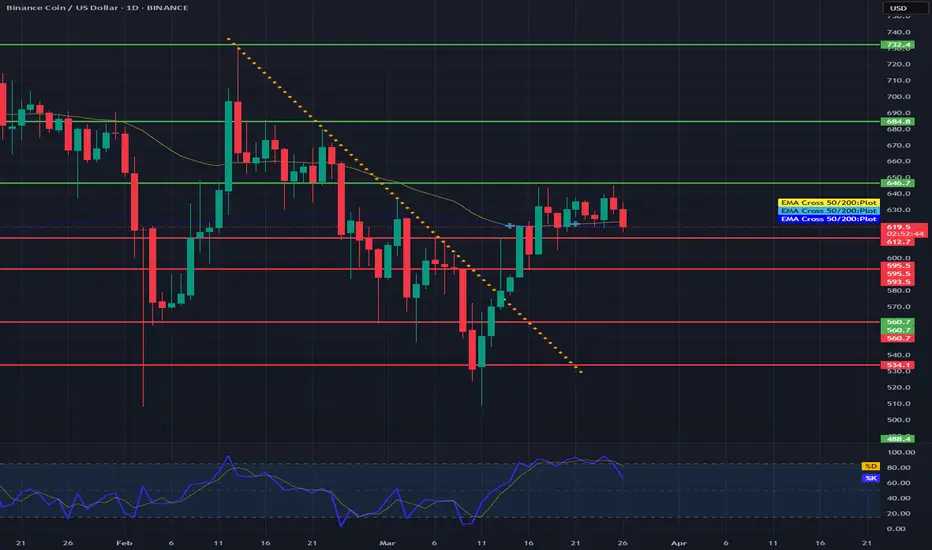
Hello everyone, let's look at the 1D BNB to USD chart, in this situation we can see how the price came out of the downtrend line, however, here it is worth observing the EMA Cross 50 and 200 indicator, which shows a fight to maintain the uptrend. Please take into account the STOCH indicator, which shows a longer movement at the upper limit of the range, which may confirm the current rebound and give a deeper correction, however, here it is important for the price to stay above the level of the last low.
Let's start by defining the goals for the near future, which the price must face:
T1 = 646 USD
T2 = 684 USD
Т3 = 732 USD
Now let's move on to the stop-loss in case the market continues to fall:
SL1 = 612 USD
SL2 = 595 USD
SL3 = 560 USD
SL4 = 534 USD
Let's start by defining the goals for the near future, which the price must face:
T1 = 646 USD
T2 = 684 USD
Т3 = 732 USD
Now let's move on to the stop-loss in case the market continues to fall:
SL1 = 612 USD
SL2 = 595 USD
SL3 = 560 USD
SL4 = 534 USD
Disclaimer
The information and publications are not meant to be, and do not constitute, financial, investment, trading, or other types of advice or recommendations supplied or endorsed by TradingView. Read more in the Terms of Use.
Disclaimer
The information and publications are not meant to be, and do not constitute, financial, investment, trading, or other types of advice or recommendations supplied or endorsed by TradingView. Read more in the Terms of Use.