I was convinced there was a crash coming last year and was charting a lot of interesting things. I was totally wrong.
Or, more kindly, we could say my timing was off (as per usual). But, revisiting my old chart, it looks like the same pattern has repeated and, once again, we're on the edge of a cliff. Last time it was all good and I was totally wrong.
But I can't shake what I'm seeing now.
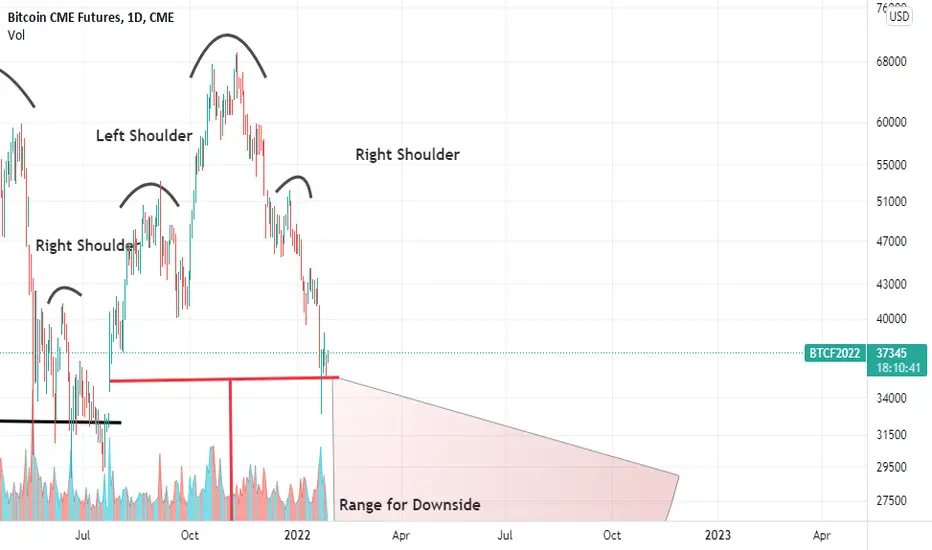
There was a clear head and shoulders in 2021 that came very close to confirming but then blasted up and never confirmed.
There is a head and shoulders now on BTC 6M chart that hasn't been confirmed but is very close. The neckline is roughly where the last one was. I don't believe in coincidences. Volume is in keeping with that pattern.
If it continues a general downward trend to $32K and beyond, it confirms and tumbles into the range I put on the chart.
If you want to go full bear on this thing, roll out to the five-year chart and look at the double top (and its support/resistance level). Same deal. Unconfirmed pattern but very close. Has to continue to drop to around $32K and beyond before it's confirmed.
If you want to go ultra bear, you could also look at the inverted cup and handle on the one-year chart. It's ticking all the boxes for that pattern but won't confirm unless it continues a trend down to $33K and beyond.
Sorry for making any crypto folks anxious. Not trying to spread despair. Just showing what I see. Again. It's not confirmed.
But where Bitcoin goes, the NASDAQ usually follows.
I'd like to say I hope I'm wrong but I went to cash and puts in '21. I couldn't shake what I was seeing in macroeconomic trends. I think we just staved off what was coming in 2021 until now.
I am sorry about all the carnage in the market for everyone. It sucks.
Or, more kindly, we could say my timing was off (as per usual). But, revisiting my old chart, it looks like the same pattern has repeated and, once again, we're on the edge of a cliff. Last time it was all good and I was totally wrong.
But I can't shake what I'm seeing now.
There was a clear head and shoulders in 2021 that came very close to confirming but then blasted up and never confirmed.
There is a head and shoulders now on BTC 6M chart that hasn't been confirmed but is very close. The neckline is roughly where the last one was. I don't believe in coincidences. Volume is in keeping with that pattern.
If it continues a general downward trend to $32K and beyond, it confirms and tumbles into the range I put on the chart.
If you want to go full bear on this thing, roll out to the five-year chart and look at the double top (and its support/resistance level). Same deal. Unconfirmed pattern but very close. Has to continue to drop to around $32K and beyond before it's confirmed.
If you want to go ultra bear, you could also look at the inverted cup and handle on the one-year chart. It's ticking all the boxes for that pattern but won't confirm unless it continues a trend down to $33K and beyond.
Sorry for making any crypto folks anxious. Not trying to spread despair. Just showing what I see. Again. It's not confirmed.
But where Bitcoin goes, the NASDAQ usually follows.
I'd like to say I hope I'm wrong but I went to cash and puts in '21. I couldn't shake what I was seeing in macroeconomic trends. I think we just staved off what was coming in 2021 until now.
I am sorry about all the carnage in the market for everyone. It sucks.
Note
Continuing to bounce near the neckline. It will have to drop under $35K in a meaningful way before this pattern could possibly be confirmed.Trade active
Up to 43K. Didn't see that coming.If it finds support here, it could spring back up to $50K.
If it can't hold or bounce here and it drops again then support is at $35K.
$35K seems to be the make and break price.
Note
Here we go.If it doesn't get above $30K and bounce, crypto is going to have a long winter.
Disclaimer
The information and publications are not meant to be, and do not constitute, financial, investment, trading, or other types of advice or recommendations supplied or endorsed by TradingView. Read more in the Terms of Use.
Disclaimer
The information and publications are not meant to be, and do not constitute, financial, investment, trading, or other types of advice or recommendations supplied or endorsed by TradingView. Read more in the Terms of Use.