Updated
open source BTCUSDT Ultimate Smart Money Chart
*** IF YOU ARE ICT , SMART MONEY AND WAVE THEORIES CHART GUY , PLEASE CONTRIBUTE , EDIT , AND SEND FEEDBACK FOR THIS CHART , PROFITS THAT "WE" (TOGETHER) GAIN IS SWEETER THAN EVERYTHING ***
Pfffff this is Ver 1.0 of my ultimate chart . TIRED *.*
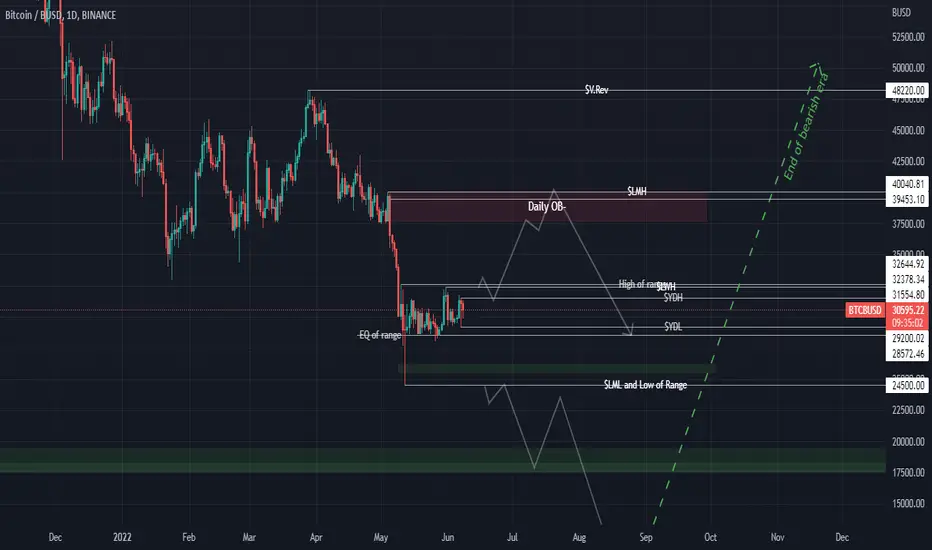
That abbreviations for long term : LWL/H ( Last Week Low/High ) V.rev ( V shape or reversal V shape chart structure ) LML/H ( Last Week Low/High)
we are at a rough range that means breaking of that Hi/Lo s I showed there will (not might :) ) EXPLODE the price up or down.
**for short termies** : there are some points into the range that price can (70% possibility) react to them reversely .
if we break above ! that bullish and further bearish will be initiated . otherwise , if we break below ! that BEARISH move to last OB+ will be initiated ,
touching that lowest OB+ will be the END OF BEARISH ERA so we can see ATH after that crush.
And I repeat again, PLEASE CONTRIBUTE IF YOU ARE ICT OR SMART MONEY OR WAVE GUY .
#BTC #btcusdt #btcusd #bitcoin #btbbusd #btcusdc
Pfffff this is Ver 1.0 of my ultimate chart . TIRED *.*
That abbreviations for long term : LWL/H ( Last Week Low/High ) V.rev ( V shape or reversal V shape chart structure ) LML/H ( Last Week Low/High)
we are at a rough range that means breaking of that Hi/Lo s I showed there will (not might :) ) EXPLODE the price up or down.
**for short termies** : there are some points into the range that price can (70% possibility) react to them reversely .
if we break above ! that bullish and further bearish will be initiated . otherwise , if we break below ! that BEARISH move to last OB+ will be initiated ,
touching that lowest OB+ will be the END OF BEARISH ERA so we can see ATH after that crush.
And I repeat again, PLEASE CONTRIBUTE IF YOU ARE ICT OR SMART MONEY OR WAVE GUY .
#BTC #btcusdt #btcusd #bitcoin #btbbusd #btcusdc
Trade active
About to DONE :) ! ✅Related publications
Disclaimer
The information and publications are not meant to be, and do not constitute, financial, investment, trading, or other types of advice or recommendations supplied or endorsed by TradingView. Read more in the Terms of Use.
Related publications
Disclaimer
The information and publications are not meant to be, and do not constitute, financial, investment, trading, or other types of advice or recommendations supplied or endorsed by TradingView. Read more in the Terms of Use.