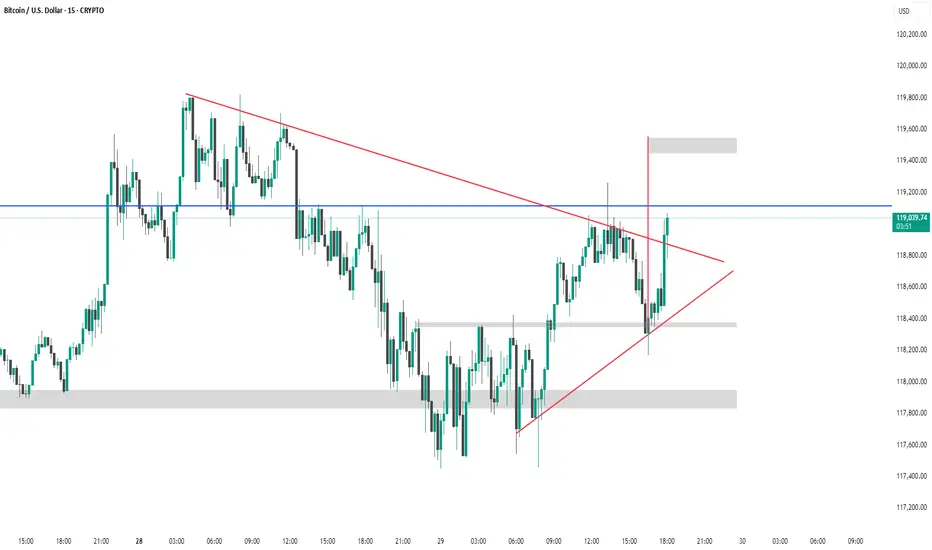
This 15-minute chart of Bitcoin/USD shows a symmetrical triangle breakout pattern. Price recently broke above the upper red trendline resistance, suggesting bullish momentum.
Key highlights:
Breakout candle is strong and closes above the resistance zone (~$119,000).
Next potential target is near the upper grey supply zone (~$119,500), based on the triangle’s height.
Support zones below are marked around $118,400 and $118,000.
This breakout indicates a possible continuation to the upside, provided the breakout holds. Watch for retests and volume confirmation.
Related publications
Disclaimer
The information and publications are not meant to be, and do not constitute, financial, investment, trading, or other types of advice or recommendations supplied or endorsed by TradingView. Read more in the Terms of Use.
Related publications
Disclaimer
The information and publications are not meant to be, and do not constitute, financial, investment, trading, or other types of advice or recommendations supplied or endorsed by TradingView. Read more in the Terms of Use.