This is the alternate theory. Posting here to see how well or bad it does. The current break up is a clean break in trend, and we are officially uptrend. You should be longing 8000 and 7700. However if those break down, then this may not be the much talked about "spring".
Note
Phase C in a wyckoff is a bulltrap. Keep that in mind.Note
As expected, bounce off the 7800 ish levels. It never did get to 7700. I expect this to test the daily MA and then start dropping back down.Note
So looks like Tradingview cut out most of my chart, posting a screenshot here:Note
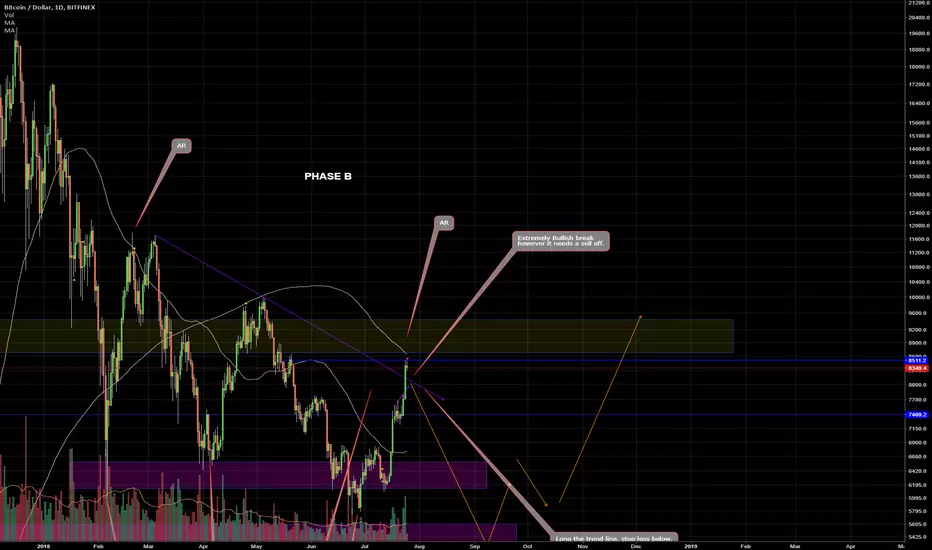
I learnt a lot about Wyckoff and trading in general from @prowdclown here is his chart
Note
As indicated earlier longing 7700 and 8000 was the game plan - we start shorting anything above 8500. Sell zone clearly shown in the chart.Note
When you see a 450 million liquidation, its best to sit on the side and wait. Lets wait. 6.8 is support.Trade closed: target reached
wait & watchNote
I am now looking to go long at 6.8 or below. If the chart plays out we will see a bottom soon. Weekly is a strong buy signal. However weekly signals dont capture price levels. Know your supports levels.Note
damn i am good.Note
Note
I want to clarify here. Weekly is signalling a buy signal i have never seen on bitcoin. Ever. Not during mt gox, not before, not after. The issue with weekly is that we dont know what price will be bottom, however all indicators point to an upcoming bull-run. Alts are at 90%+ discounts.Note
Another view of the cleaned up chart .... if these two rectangles are not buy zones then i may as well give up trading. We are in buy zone #1Note
Looks like this chart is playing out now. My other setups are all invalidated. This is a pretty scary chart.Disclaimer
The information and publications are not meant to be, and do not constitute, financial, investment, trading, or other types of advice or recommendations supplied or endorsed by TradingView. Read more in the Terms of Use.
Disclaimer
The information and publications are not meant to be, and do not constitute, financial, investment, trading, or other types of advice or recommendations supplied or endorsed by TradingView. Read more in the Terms of Use.