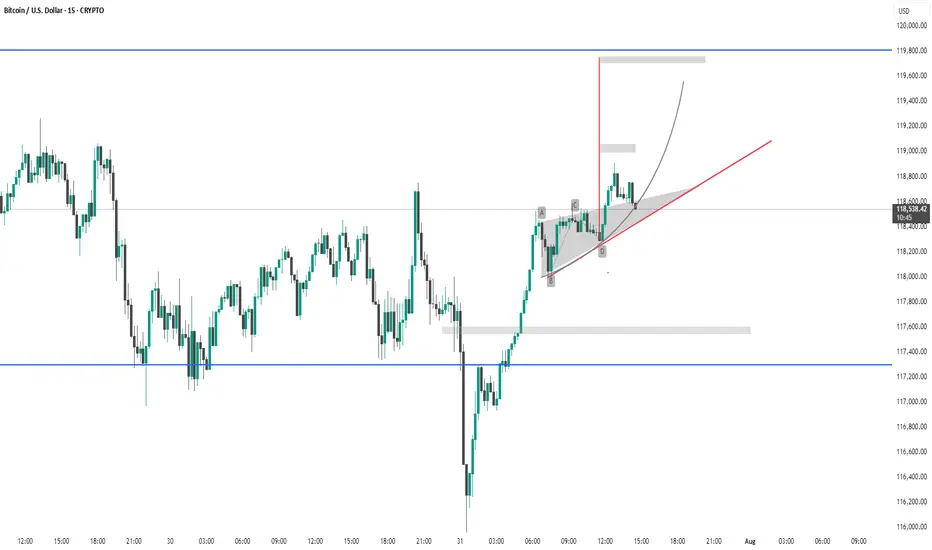
This 15-minute chart of Bitcoin (BTC/USD) shows a strong bullish recovery from the support zone near 117,200 (blue horizontal line). Price has formed a bullish continuation pattern (potential ascending triangle or flag) supported by the red trendline. The gray curved arrow suggests a projected bullish breakout toward the 119,600–119,800 resistance area. The breakout above the shaded demand zone and consolidation near the highs indicates strong buying interest. Watch for a clean breakout above recent highs for continuation.
Related publications
Disclaimer
The information and publications are not meant to be, and do not constitute, financial, investment, trading, or other types of advice or recommendations supplied or endorsed by TradingView. Read more in the Terms of Use.
Related publications
Disclaimer
The information and publications are not meant to be, and do not constitute, financial, investment, trading, or other types of advice or recommendations supplied or endorsed by TradingView. Read more in the Terms of Use.