In science, when I cannot navigate whatever I am observing under the microscope, I zoom out the lenses and readjust my focus to gain a general sense of the position of the specimen.
The same applies to charting. A long time frame (6day chart) allows us to take a step back from the micro and look at the bigger picture of price action.
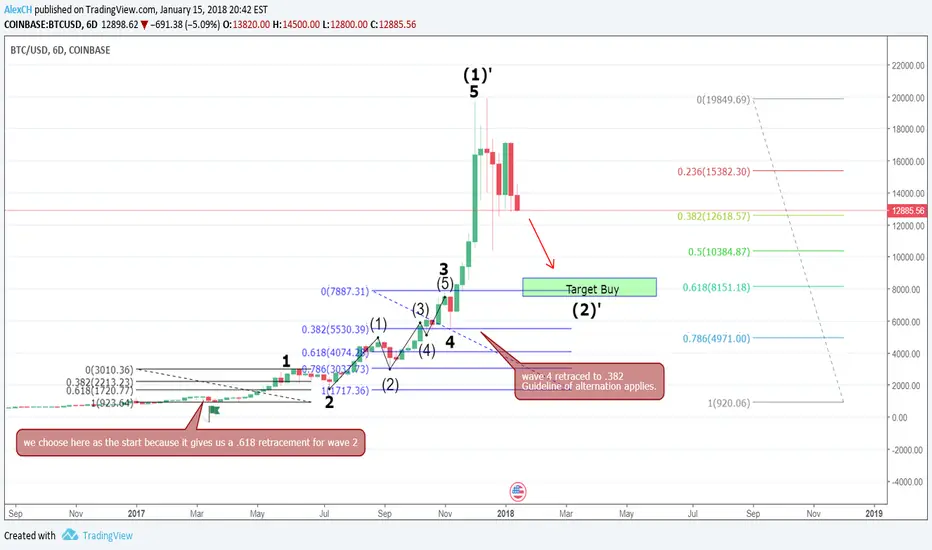
Now, let's take a look at this 6-day chart of bitcoin/usd!
On the chart, please count with me:
- waves 1,2,3,4,5 marked in bold black text, they together make a giant leg (1)'
- waves A,B,C,D,E. They are the 5 subwaves of wave 3.
- waves 1 and 5 are also composed of their own five subwaves. They are not marked on the chart.
--> We are in wave (2)' .
**My conclusion is that wave (2)' will end at around $8200 (green box). And the following is me justifying my analysis.
Before diving into the analysis, there are two crucial assumptions that I made:
The first being the position of the start of wave 1 (marked with a flag).
I identified wave 3 first (composed of A,B,C,D,E). Then, it is obvious where wave 4 and 5 is.
-->The blue fib retracement tool shows wave 4 retraced to .382
-->I assume wave 2 will retrace to .618 based on guideline of alternation.
-->The flag (assumed start of wave 1) gives wave 2 a .618 retracement (black fib retracement tool).
-->Wave 2 took a long time to finish while wave 4 only spanned one candle. Again, the guideline of alternation applies.
These are the reasons why I picked the flagged point as the start of wave 1.
The second assumption is the expectation of a retracement to .618 level on the colored fib retracement tool. **ie, a .618 retracement of (1)'
The supporting evidence is the confluence with the position of wave 4. What I mean is a retracement often retraces to around wave 4 of the previous subwave. In this case, the position of wave 4 is close to the expected .618 retracement of wave (2)' --> reasonable confluence.
- Indicators:
We are now trading under MA100 on 6hour chart. This is a rather strong indication of a downward trend for the medium term at least. Although we are still trading above MA100 on daily chart, I believe it will catch up eventually.
- Estimated time frame: 2 weeks ~ 2 months.
Please share your thoughts!
The same applies to charting. A long time frame (6day chart) allows us to take a step back from the micro and look at the bigger picture of price action.
Now, let's take a look at this 6-day chart of bitcoin/usd!
On the chart, please count with me:
- waves 1,2,3,4,5 marked in bold black text, they together make a giant leg (1)'
- waves A,B,C,D,E. They are the 5 subwaves of wave 3.
- waves 1 and 5 are also composed of their own five subwaves. They are not marked on the chart.
--> We are in wave (2)' .
**My conclusion is that wave (2)' will end at around $8200 (green box). And the following is me justifying my analysis.
Before diving into the analysis, there are two crucial assumptions that I made:
The first being the position of the start of wave 1 (marked with a flag).
I identified wave 3 first (composed of A,B,C,D,E). Then, it is obvious where wave 4 and 5 is.
-->The blue fib retracement tool shows wave 4 retraced to .382
-->I assume wave 2 will retrace to .618 based on guideline of alternation.
-->The flag (assumed start of wave 1) gives wave 2 a .618 retracement (black fib retracement tool).
-->Wave 2 took a long time to finish while wave 4 only spanned one candle. Again, the guideline of alternation applies.
These are the reasons why I picked the flagged point as the start of wave 1.
The second assumption is the expectation of a retracement to .618 level on the colored fib retracement tool. **ie, a .618 retracement of (1)'
The supporting evidence is the confluence with the position of wave 4. What I mean is a retracement often retraces to around wave 4 of the previous subwave. In this case, the position of wave 4 is close to the expected .618 retracement of wave (2)' --> reasonable confluence.
- Indicators:
We are now trading under MA100 on 6hour chart. This is a rather strong indication of a downward trend for the medium term at least. Although we are still trading above MA100 on daily chart, I believe it will catch up eventually.
- Estimated time frame: 2 weeks ~ 2 months.
Please share your thoughts!
Note
Another analogy:Think about displacement vs. distance, and how velocity is different from speed.
When we look at higher time frames, we are looking at displacement. We just care about the endpoint. We do not care how much distance it travels to reach the final destination.
Note
When we drop below 10K, they will say it's the end of btc and the bubble has burst. We will be loading up our bags at that time! And we will be the winning traders!Note
take care tradersTrade active

This is a link to CryptoPrediction's idea of bitcoin price action.
Amongst the top analysists, he is the only one I see so far that expects a correction to sub 10K range.
I completely agree with him. We got to the same buy zone using slightly different TA.
Please take care.
Trade active
Everything is going to planTrade active
get ready to close your short position/open new long positions.Target should be reached within 3 days
Note
I am fully liquidated at the moment.
If we break resistance, I will be buying back at higher price.
We can easily drop another 150 billion in market cap, I do not want to risk that.
The chart is bullish in short time frame (up to 2hr).
4 Hr chart and above still look bearish.
I decide to be discipline and reduce my risk.
Trade active
Above 12000, I will now start to buy backTrade active
As soon as something fishy comes up on the chart I will close all my positions without hesitation.Normally, a support has to be tested multiple times.
We bounced strong from 9XXX yesterday and closed the day with a beautiful candle.
The market can easily test it again. Take a LOT of caution.
Trade active
Note
Note
We reached our target on jan18.
Look for price action around 13k-13.5k
I am still bearish until we break those levels
Note

This is a link to my short term update.
Trade active
This post is still validTrade active
We are almost thereTrade closed: target reached
We have touched our targets. I have a newer analysis on BTC/USD, I do believe we can go lower.
This idea has served its purpose :)
Note
The wick touched the very bottom of our buy zone.We nailed it!
I am very proud of this post :)
Trade active
Let's go to 5K!???Note
look at this $8200!
Disclaimer
The information and publications are not meant to be, and do not constitute, financial, investment, trading, or other types of advice or recommendations supplied or endorsed by TradingView. Read more in the Terms of Use.
Disclaimer
The information and publications are not meant to be, and do not constitute, financial, investment, trading, or other types of advice or recommendations supplied or endorsed by TradingView. Read more in the Terms of Use.