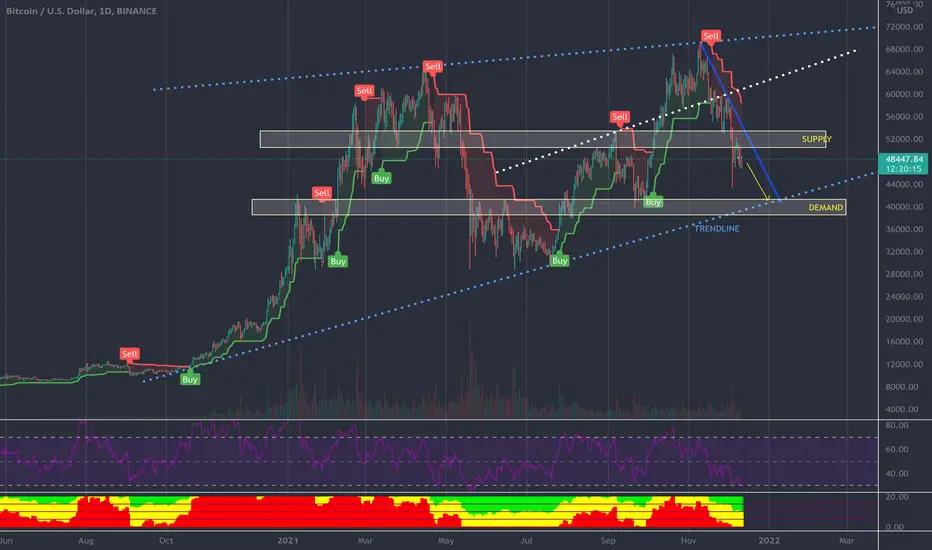
Look like it is a must to test the trend line at about 40k ?
but RSI oversold...so may be go up to supply 1 more time then heading down.
(Not financial advise just my assumption )
but RSI oversold...so may be go up to supply 1 more time then heading down.
(Not financial advise just my assumption )
Note
May be squeezing down for a while until it read the blue line just like May'21 crashNote
I wish i could delete the typos its "TF Day" and that white line middle chart . it suppose to be under the tip current candlestick toward lowest canddlestick of previous wave, then you'll see there's a chance of going up right away because that support line still holds.Trade closed: target reached
Disclaimer
The information and publications are not meant to be, and do not constitute, financial, investment, trading, or other types of advice or recommendations supplied or endorsed by TradingView. Read more in the Terms of Use.
Disclaimer
The information and publications are not meant to be, and do not constitute, financial, investment, trading, or other types of advice or recommendations supplied or endorsed by TradingView. Read more in the Terms of Use.