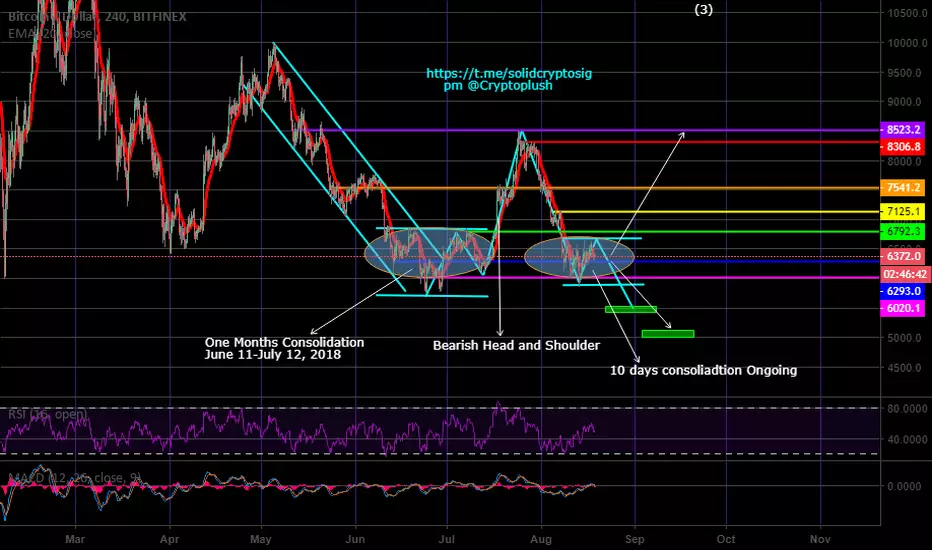
Interesting to watch  BTC as it continues to trade sideways within a very tight range for ten straight days. This to me seems like we are seeing a repeat of the same move we had in june when price traded within a tight range for 13 staright days before breaking to a new low of $5775, and traded sideways for another 17 after the bounce from below before breaking above.
However, i continue to remain bearish within this extremely choppy zone as we have not seen any price action within this tight range besides the wicks choping up and down and sending margin/leverage traders right to rekt island.
Daily- Our last analysis on daily remain the same. We remain stuck within the bear flag formation, right shoulder of the head and shoulder formation, and the fallen wedge formation.
Ideally i would like to see a break of the $6600 resistance towards the $6800-$7100 resistance, set a lower high and higher low, and then enter into an equilibrum pattern.
But this three strong bearish scenerio, coupled with the inability of the bulls to push through this resistance in the last 10 days, and the bearish MACD seems to be making me doubt the possibility of this ever happening. The Bulls really need to prevent price from hammering the floor at $6100-$6000 support area because the more times a market comes to test a key level, the more likely the market break that level.
4 Hour— Seems to be on very strong consolidation now in the last 10 days having an upper range of $6500-$6600 that continues to reject us.
But similar to the floor i spoke about on the daily, the roof here will act the same way. if the bulls continue to drill it, it will eventually give way soon.
Moreover, above $6600, i did look for a short squeeze to give us the pump towards $6800-$7100 which will make us more healthier on the daily chart. But keep in mind that the volume is not there yet, so we will watch for a spike in volume arround this area in coming days to indicate the bulls are in control.
Overall, if the market continues to trade withing this tight range, Bitcoin is expected to continue to form the potential bear flag where we are awaiting a potential flag pole down.
If that pattern is invalidated, then we'll likely break upwards and retest the $6800 level and possibly $8500.
If we break downwards below $6k, we may see more of the capitualtion we experienced the other day, and this may push price to new lows if the bulls fails to $5800-$5700.
Finally, keep in mind that which ever direction bitcoin breaks, it is going to break aggressively (just like we saw in june after the long consolidation), and there will be huge opportunity to margin trade with masive volatility on either direction.
t.me/solidcryptosig
cryptoplush
Related publications
Disclaimer
The information and publications are not meant to be, and do not constitute, financial, investment, trading, or other types of advice or recommendations supplied or endorsed by TradingView. Read more in the Terms of Use.
Related publications
Disclaimer
The information and publications are not meant to be, and do not constitute, financial, investment, trading, or other types of advice or recommendations supplied or endorsed by TradingView. Read more in the Terms of Use.