🧠 Chart Context & Structure
Timeframe: 1D (Daily)
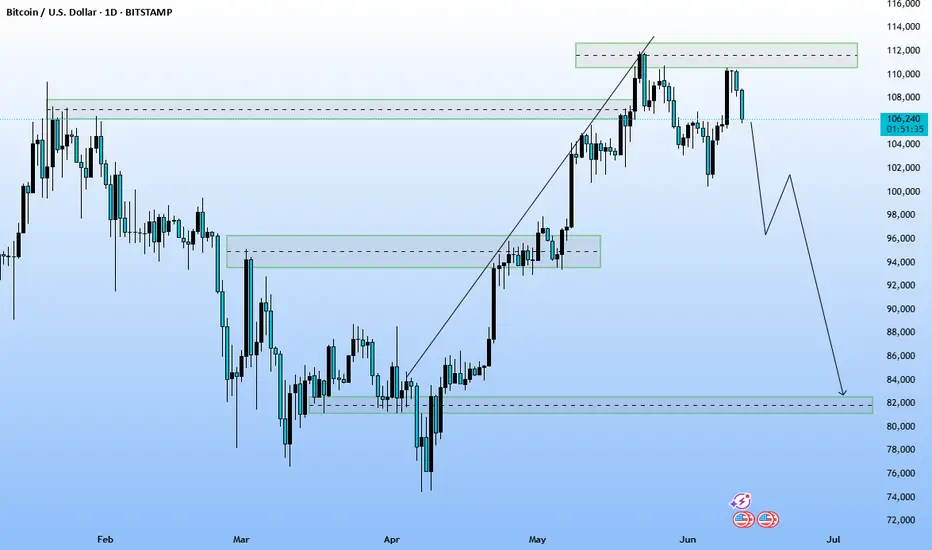
Instrument: Bitcoin / U.S. Dollar (BTC/USD)
📊 Key Technical Elements
1. Recent Trend:
Strong bullish impulse from mid-April to early June.
After touching a resistance zone (around 112,000), price began to pull back.
2. Resistance Zone:
Marked in a green box at the top, around 110,000–112,000 USD.
Price faced rejection after tapping into this area twice.
3. Support Zones:
Intermediate support near 96,000–98,000 USD.
Major support around 82,000 USD, drawn from previous price consolidation.
🔮 Forecasted Price Path (Based on Drawing):
First leg: Price is expected to drop toward the 96k region.
Possible bounce: A slight upward retracement may occur there.
Final leg: Continuation of bearish move toward 82,000 USD major support.
This resembles a lower-high + breakdown scenario, typical of distribution or topping patterns.
🧭 Potential Trade Idea:
Short Bias: As long as price remains below 110,000 resistance zone.
Entry: After confirmation of breakdown below 104,000–102,000.
Targets:
First: 96,000
Final: 82,000
Invalidation: Clean breakout and daily close above 112,000
Timeframe: 1D (Daily)
Instrument: Bitcoin / U.S. Dollar (BTC/USD)
📊 Key Technical Elements
1. Recent Trend:
Strong bullish impulse from mid-April to early June.
After touching a resistance zone (around 112,000), price began to pull back.
2. Resistance Zone:
Marked in a green box at the top, around 110,000–112,000 USD.
Price faced rejection after tapping into this area twice.
3. Support Zones:
Intermediate support near 96,000–98,000 USD.
Major support around 82,000 USD, drawn from previous price consolidation.
🔮 Forecasted Price Path (Based on Drawing):
First leg: Price is expected to drop toward the 96k region.
Possible bounce: A slight upward retracement may occur there.
Final leg: Continuation of bearish move toward 82,000 USD major support.
This resembles a lower-high + breakdown scenario, typical of distribution or topping patterns.
🧭 Potential Trade Idea:
Short Bias: As long as price remains below 110,000 resistance zone.
Entry: After confirmation of breakdown below 104,000–102,000.
Targets:
First: 96,000
Final: 82,000
Invalidation: Clean breakout and daily close above 112,000
Disclaimer
The information and publications are not meant to be, and do not constitute, financial, investment, trading, or other types of advice or recommendations supplied or endorsed by TradingView. Read more in the Terms of Use.
Disclaimer
The information and publications are not meant to be, and do not constitute, financial, investment, trading, or other types of advice or recommendations supplied or endorsed by TradingView. Read more in the Terms of Use.