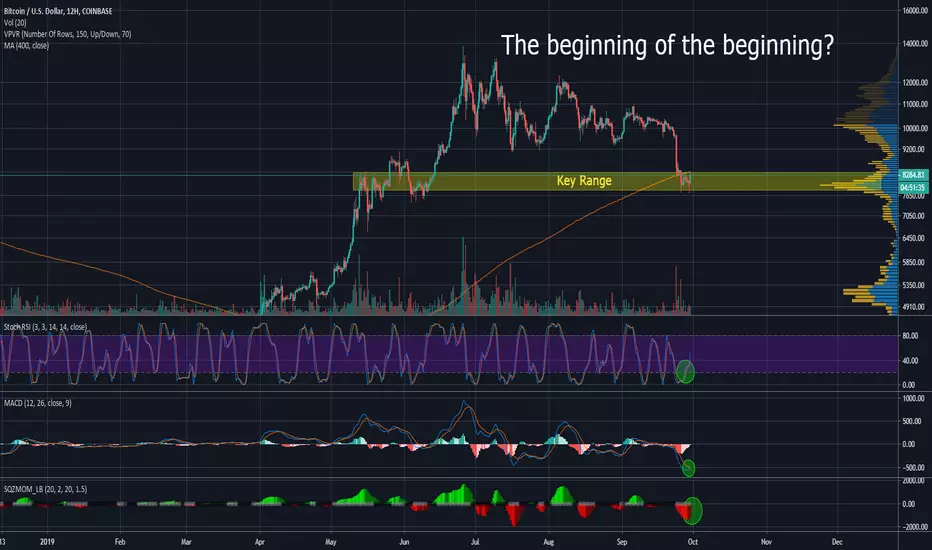
Normally, I stick to the daily and weekly timeframes to monitor for any longer term trends. However, after watching the price of BTC break below the 200 day MA and hold beneath it, I'm dying for some optimism here, so I took a look at the 12 hr chart to see if I could spot an emerging trend before it shows on the daily.
And would you look at what I found! Stochastic RSI crossing into the neutral zone from the bottom, typically a bullish sign. MACD is showing some initial bullish signs as well, with a cross looking imminent and both lines beginning to trend up. The squeeze momentum indicator is also indicating a decay in the negative trend we've been dealing with.
The daily chart isn't quite as optimistic, as the shifts we see on the 12hr haven't yet made it over. There are several bullish hammer candles on the daily chart in the last few days, though, which is a good sign. Hopefully the shifts we see here on the 12hr are predicting the shifts we will see emerge on the daily chart... Fingers crossed.
Disclaimer
The information and publications are not meant to be, and do not constitute, financial, investment, trading, or other types of advice or recommendations supplied or endorsed by TradingView. Read more in the Terms of Use.
Disclaimer
The information and publications are not meant to be, and do not constitute, financial, investment, trading, or other types of advice or recommendations supplied or endorsed by TradingView. Read more in the Terms of Use.