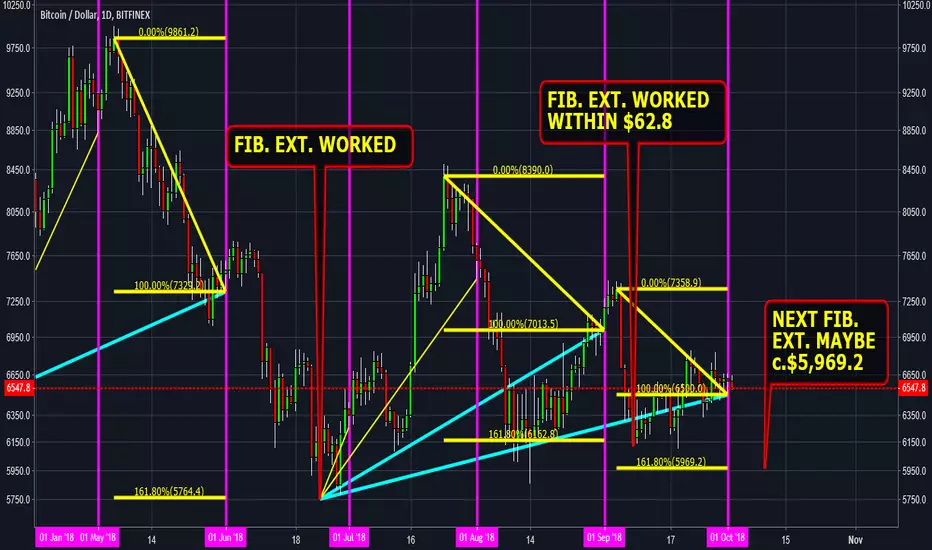
#bitcoin new study using Fib Extensions plus first day of month low, plus trend lines from a lower low, and fanning out from a higher high (marked in light blue). Multiply by Fib. 1.618 the low of first day of month less previous high on the close (not the high).
Note
Here's bigger pictureNote
If bulls can hold do you see on the chart below what a beautiful moon could mean? Note
Waiting........Note
In the chart below I'm thinking that for price to have bottomed on the weekly chart do we also need to make a consecutive weekly Williams Fractal low. Maybe a higher weekly high now could be one step nearer to getting it done quickly. $6,921.4 is a 61.8 retrace. I've gone for a bit lower.
Note
Here's what I mean Note
Based on my TO THE MOON study posted 2nd October we also got consecutive daily low in the first example reproduced again below Note
How useful are consecutive daily fractal lows at identifying lows. Well maybe once a year? Have marked them in white in the chart below. Didn't check for sure in detail but does look like at least one of them managed to catch each yearly low.Note
My latest post which is an update of an older study "bitcoin bulls could surprise & surpass expectation 50/50"Note
Bigger pictureNote
Whatever you use or create on a chart not all of them will create value for a repeatable trading strategy, however, being able to see the position of the many patterns (or a single pattern) on a chart like halfway through a game of chess may just help identify or perfect new ones. In this study below I was interested in creating patterns (just triangles) in between different coloured Aroon bars. Like between 100 of one colour to the 100 of the next, including to where the next colour first rises above the previous. Once complete i edited out all those I didn't think were useful, and to see what conditions may continue to support the view that bitcoin had bottomed, etc....Note
More studiesNote
I think I may have discovered the secret to the next big buy/sell signal. Will be watching how this chart develops.Note
Big question if histogram goes lower than yesterday 7th Oct, in which case I would add the final green vertical to my chart, and the RSI goes below that of the first green vertical of 49.8317 would that be a buy signal.Note
(Update) Question if histogram ends lower than 9th Oct, in which case would add the final green vertical to my chart, and RSI ends below first green vertical of 49.8317 would that be a buy signal. The green and purple DNA of the Histogram matches two other recent occasions but they signalled tops. You will find all of my bull and bear arguments in my post 24th September "#bitcoin bull bear watch don't get caught out".
Has bitcoin bottomed?
I think we could be about to find out today unless price rises back up, or, need review.
I have boxed in some primary areas of interest to me for comparing recent past, and added below extra photo's for comparison with previous examples.
Note
The RSI did not end below 49.8317. Therefore, the above observation does not help with a bullish argument.Note
#bitcoin fractal patterns same as December but with a twistHere's my latest observation, and below comparing December's example. 50/50 price finds support and my to the moon charts/arguments remain intact. Some of my bearish charts/arguments still have 50/50 chance too.
Note
#bitcoin could rebound tomorrow thanks to gold price leapHere is the daily chart of gold 2.50% 2.09% and bitcoin -4.80% -4.83% . Notice my use of Aroon 1 (blue) 11 (brown). Notice the correlation with Bitcoin -4.80% -4.83% when brown Aroon hits 100. Have boxed in volatility to nearest Blue Aroon at 100. The Aroon is done using the Gold 2.50% 2.09% chart. I've superimposed the brown Aroon on bitcoin -4.80% for better clarity.
Note that move could also be short lived to just one day, or, none at all. 3rd March didn't work well at all. Looks quite good at catching bitcoin -4.80% at point of rebound. All ideas 50/50
Note
Looking good so farNote
From my latest post "bitcoin another bullish argument/chart for the bulls". A new study to add to the many I've done. Used CCI in log scale which revealed some interesting insight because all year these are the only two occasions with this much and the same amount of choppiness . The last time it was bullish . Could it repeat. My only worry at the minute is that my last key signal was bearish . Note
GREAT NEWS FOR BULLSNote
Another encouraging bullish observationNote
If you wish to view the last 52 charts in one thread check out my post dated Sept. 24Disclaimer
The information and publications are not meant to be, and do not constitute, financial, investment, trading, or other types of advice or recommendations supplied or endorsed by TradingView. Read more in the Terms of Use.
Disclaimer
The information and publications are not meant to be, and do not constitute, financial, investment, trading, or other types of advice or recommendations supplied or endorsed by TradingView. Read more in the Terms of Use.