Good day,
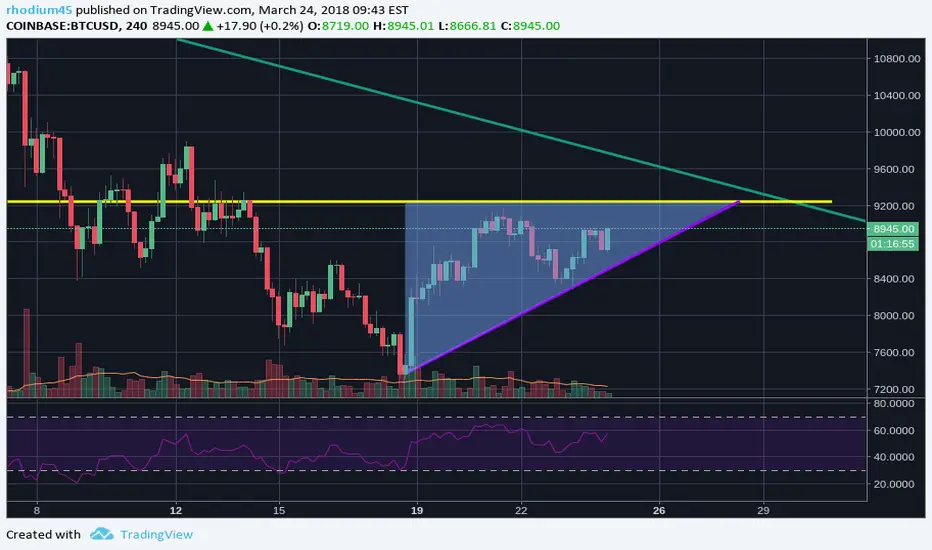
this TA is quite hard to do since the current price action seems indecisive to me. It looks like Bitcoin might be trapped inside a ascending triangle, which usually is a bullish sign. The yellow line, in my point of view acts as a strong resistance. I initially drew it as a neckline for the double top that happened approximately nineteen days ago. I think that the triangle will most likely turn out bearish, because of the RSI currently sitting at 57 and the strong resistance at around 9250$. The bearish market sentiment also favors a bearish outcome.
There's also the possibility of breaking out to the upside. In that case I would keep an close eye on the volume and RSI, to possibly identify a potential bulltrap.
- Cheers
(4h chart)
Disclaimer
The information and publications are not meant to be, and do not constitute, financial, investment, trading, or other types of advice or recommendations supplied or endorsed by TradingView. Read more in the Terms of Use.
Disclaimer
The information and publications are not meant to be, and do not constitute, financial, investment, trading, or other types of advice or recommendations supplied or endorsed by TradingView. Read more in the Terms of Use.