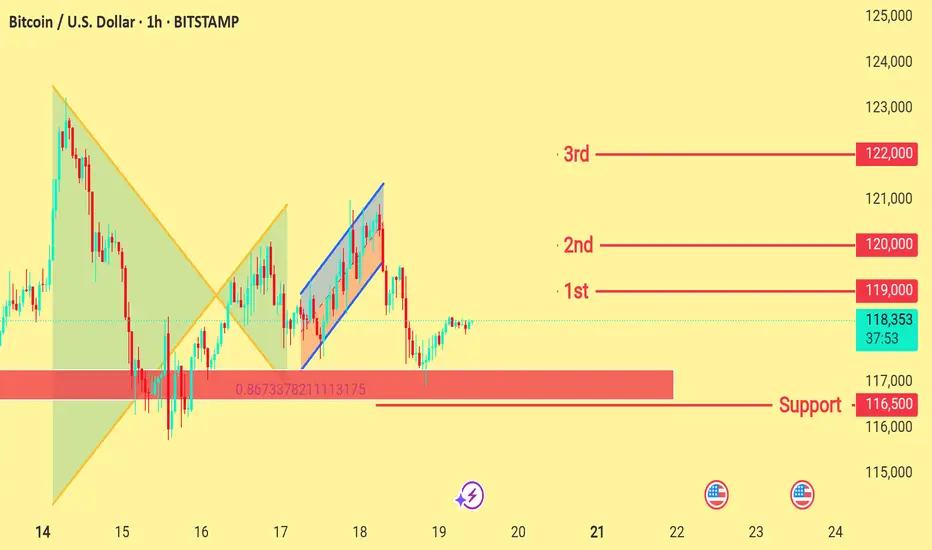
Bitcoin is currently trading around 118,333, showing a minor intraday recovery. The chart highlights a key support zone near 116,500, which has held well during recent retracements.
If upward momentum sustains, price may test the following resistance levels:
1st Target: 119,000
2nd Target: 120,000
3rd Target: 122,000
Price action suggests a potential bullish structure forming above support. Traders may watch for confirmation of breakout levels before considering directional bias.
---
Let me know if you'd like this translated to Urdu or want a slightly more aggressive or conservative version.
Disclaimer
The information and publications are not meant to be, and do not constitute, financial, investment, trading, or other types of advice or recommendations supplied or endorsed by TradingView. Read more in the Terms of Use.
Disclaimer
The information and publications are not meant to be, and do not constitute, financial, investment, trading, or other types of advice or recommendations supplied or endorsed by TradingView. Read more in the Terms of Use.