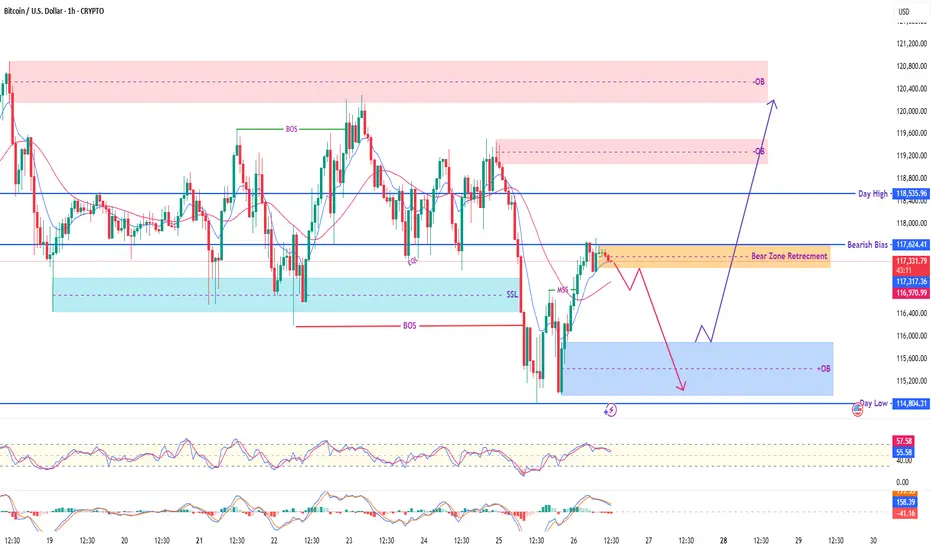
What's up, TradingView fam! 👋 Here's a fresh 1-hour chart analysis for Bitcoin (BTC/USD), highlighting key price action and potential scenarios as the market navigates a critical zone.
Current Market Snapshot:
Price Retracement: BTC is currently in a 'Bear Zone Retracement' phase, hovering around $117,300 - $117,400. This suggests a pullback within a broader bearish move.
Bearish Bias 🐻: Our analysis indicates a prevailing 'Bearish Bias' in the short-term, meaning we're looking for potential selling opportunities or further downside.
Day High & Day Low: Key reference points are the 'Day High' at $118,505 and the 'Day Low' at $114,804.
Key Zones & Liquidity Pools:
Upper Order Block (Red OB) 🔴: A significant supply zone overhead, from $119,000 to $120,500. This area could offer strong resistance if price attempts to move higher.
Current Retracement Zone (Yellow Highlight) 📉: This is our 'Bear Zone Retracement' area around $117,200 - $117,500. This zone previously acted as support and could now flip to resistance, signaling a continuation of the bearish trend.
Lower Order Block (Blue OB) 🔵: A potential demand zone below, roughly $115,000 - $115,700. If price pushes lower, this could be an area for a bounce or temporary support.
SSL (Sell Side Liquidity) 🎯: Notice the sweep of 'Sell Side Liquidity' (SSL) around $116,500 recently. This liquidity grab often precedes a move in the opposite direction or a deeper pullback before continuation.
Potential Scenarios (Follow the Purple Arrows! 🔮):
Bearish Continuation (Most Likely Scenario) ⬇️: Given the 'Bearish Bias' and the current retracement into the 'Bear Zone', we could see rejection from current levels or a slight push higher to retest the upper part of this zone. From there, price might head down towards the Lower Order Block ($115,000 - $115,700), potentially retesting the 'Day Low' at $114,804.
Bullish Reversal (Less Likely, but Possible) ⬆️: A less probable but possible scenario involves price breaking above the current 'Bear Zone Retracement' and pushing higher. If it can clear the 'Day High' at $118,505, it might target the Upper Order Block ($119,000 - $120,500). This would invalidate the short-term bearish bias.
Indicators Check:
RSI: Currently around 57, showing a slight recovery but still with room to move.
Stochastic: Trending downwards, supporting the bearish momentum.
Always remember to trade smart, manage your risk, and wait for confirmation. This is not financial advice. Do your own research! 🛡️📊
Don't forget to Like 👍, Comment 💬, and Follow for more detailed analyses!
#BTC #Bitcoin #Crypto #Trading #TechnicalAnalysis #SmartMoneyConcepts #PriceAction #BTCUSD #MarketAnalysis"
Note
don't be worry liquidity hunter Disclaimer
The information and publications are not meant to be, and do not constitute, financial, investment, trading, or other types of advice or recommendations supplied or endorsed by TradingView. Read more in the Terms of Use.
Disclaimer
The information and publications are not meant to be, and do not constitute, financial, investment, trading, or other types of advice or recommendations supplied or endorsed by TradingView. Read more in the Terms of Use.