Title: "BTCUSD Head and Shoulders Formation: Key Levels to Watch for Potential Breakdown or Reversal"
---
Description of the Analysis:
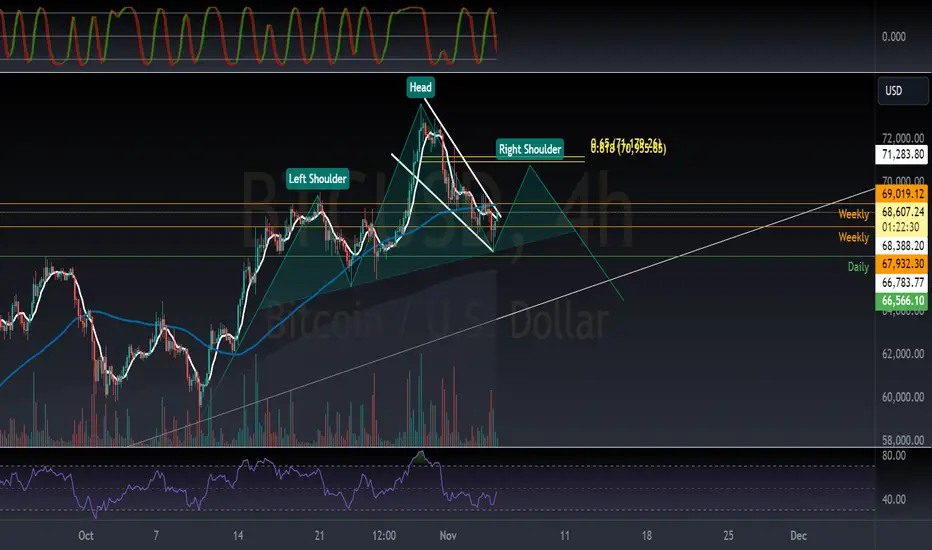
This BTCUSD 4-hour chart showcases a **Head and Shoulders pattern**, a classic formation often signaling a potential trend reversal. As Bitcoin trades within this pattern, traders should closely monitor the neckline and key levels to identify possible breakdowns or reversals.
1. Pattern Overview:
- The **Head and Shoulders** structure consists of three peaks: the Left Shoulder, the Head (the highest peak), and the Right Shoulder. Typically, this pattern implies a bearish setup, as the price often drops after breaking below the neckline.
2. Key Resistance and Support Levels:
- **Weekly Resistance** levels at **69,019.12** and **68,548.42** indicate major overhead resistance. If the price attempts a move upward, these levels may act as a barrier.
- A **Fibonacci retracement** level at **70,193.36** aligns with the 0.618 level, adding additional resistance if the price retraces higher within the pattern.
- The **Daily Support** level at **66,566.10** aligns with the neckline. A break below this level would confirm the head and shoulders breakdown, suggesting further downside movement.
3. Indicators and Momentum:
- **RSI**: Currently near 39.38, approaching oversold territory, though not showing strong bullish divergence. If RSI forms higher lows while price trends lower, it may signal a bullish divergence.
4. Potential Scenarios:
- Bearish Breakdown: If BTCUSD breaks below the neckline at **66,566.10**, this would confirm the head and shoulders pattern. This could trigger further downside, with short opportunities targeting lower support levels.
- Bullish Reversal: If BTCUSD finds support above **66,566.10** and pushes past the **68,388.20** daily level, a reversal may be in play. A close above **70,193.36** (the Fibonacci level) would strengthen the bullish case, with resistance targets near **72,000**.
5. Risk Management and Entry Strategy:
- For a bearish breakdown, consider entering short positions below the neckline with a stop-loss just above it, scaling into the position as the price confirms the downtrend.
- For a bullish reversal, look for high volume and strong price action above resistance levels before entering, setting stops near the neckline or key support to manage risk effectively.
Summary:
In summary, this analysis identifies a key head and shoulders pattern on BTCUSD’s 4-hour chart, with potential for a bearish breakdown below the neckline or a bullish reversal if support holds and price reclaims resistance. Traders should closely observe the Fibonacci retracement level, weekly resistance, and daily support levels for entries and exits, supported by momentum indicators for confirmation.
---
Description of the Analysis:
This BTCUSD 4-hour chart showcases a **Head and Shoulders pattern**, a classic formation often signaling a potential trend reversal. As Bitcoin trades within this pattern, traders should closely monitor the neckline and key levels to identify possible breakdowns or reversals.
1. Pattern Overview:
- The **Head and Shoulders** structure consists of three peaks: the Left Shoulder, the Head (the highest peak), and the Right Shoulder. Typically, this pattern implies a bearish setup, as the price often drops after breaking below the neckline.
2. Key Resistance and Support Levels:
- **Weekly Resistance** levels at **69,019.12** and **68,548.42** indicate major overhead resistance. If the price attempts a move upward, these levels may act as a barrier.
- A **Fibonacci retracement** level at **70,193.36** aligns with the 0.618 level, adding additional resistance if the price retraces higher within the pattern.
- The **Daily Support** level at **66,566.10** aligns with the neckline. A break below this level would confirm the head and shoulders breakdown, suggesting further downside movement.
3. Indicators and Momentum:
- **RSI**: Currently near 39.38, approaching oversold territory, though not showing strong bullish divergence. If RSI forms higher lows while price trends lower, it may signal a bullish divergence.
4. Potential Scenarios:
- Bearish Breakdown: If BTCUSD breaks below the neckline at **66,566.10**, this would confirm the head and shoulders pattern. This could trigger further downside, with short opportunities targeting lower support levels.
- Bullish Reversal: If BTCUSD finds support above **66,566.10** and pushes past the **68,388.20** daily level, a reversal may be in play. A close above **70,193.36** (the Fibonacci level) would strengthen the bullish case, with resistance targets near **72,000**.
5. Risk Management and Entry Strategy:
- For a bearish breakdown, consider entering short positions below the neckline with a stop-loss just above it, scaling into the position as the price confirms the downtrend.
- For a bullish reversal, look for high volume and strong price action above resistance levels before entering, setting stops near the neckline or key support to manage risk effectively.
Summary:
In summary, this analysis identifies a key head and shoulders pattern on BTCUSD’s 4-hour chart, with potential for a bearish breakdown below the neckline or a bullish reversal if support holds and price reclaims resistance. Traders should closely observe the Fibonacci retracement level, weekly resistance, and daily support levels for entries and exits, supported by momentum indicators for confirmation.
Disclaimer
The information and publications are not meant to be, and do not constitute, financial, investment, trading, or other types of advice or recommendations supplied or endorsed by TradingView. Read more in the Terms of Use.
Disclaimer
The information and publications are not meant to be, and do not constitute, financial, investment, trading, or other types of advice or recommendations supplied or endorsed by TradingView. Read more in the Terms of Use.