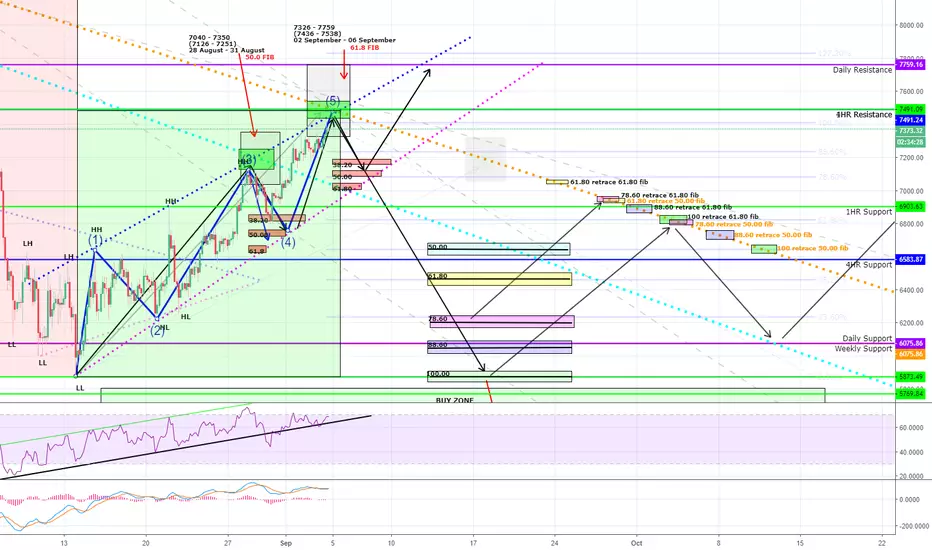
***This chart is based off the current high sitting just over 7400 and fib lines will change once High is confirmed.***
If BTC continues up to hit the weekly trend line like I have drawn then these fib mark out areas will be slightly corrected to suit once the high is confirmed. This is however what I am looking at as we speak. I believe either one of these two options will occur....
OPTION 1- We break down after hitting the weekly trend (orange dotted line), bounce on the 50.00 Fib mark (confirming a new Higher Low) before continuing another leg up, breaking the bearish trend and hopefully closing above 7500 mark. ///////// Or break the weekly trend line right away and close above the 7500 mark confirming a possible trend reversal.
OPTION 2- Hit the weekly trend line like I have drawn (orange dotted line). Consolidating down to i believe either two of my marked fib lines. Either the 88.60 fib retracement or the 100.00 fib retracement bouncing back up to hit the correlating 61.8 fib marked points on the weekly trend line (50.00 are there as a secondary option).
I will adjust numbers once a short term High is confirmed in the next few hours - day to verify my analysis. I will also go into more detail about my analysis, however if you are interested please read up on my original Chart on BTC posted earlier and linked to this update.
I am new to charting and slowly learning. This is only what I see happening and I do welcome any and all feedback, I want to learn as mush as possible from you all and i hope to give you all something back.
Alex.
Related publications
Disclaimer
The information and publications are not meant to be, and do not constitute, financial, investment, trading, or other types of advice or recommendations supplied or endorsed by TradingView. Read more in the Terms of Use.
Related publications
Disclaimer
The information and publications are not meant to be, and do not constitute, financial, investment, trading, or other types of advice or recommendations supplied or endorsed by TradingView. Read more in the Terms of Use.
