The signs are there, the chart says it all, we dont have to be too emotional about this.
The informations presented to us by the market clearly tells us the direction of #BTC price in coming days/weeks........the facts are there on the chart, we dont have to allow our rigidity to keep us down in a world of denial.......
Bear flag
Weak volume
Head and Shoulder Pattern
Fallen Wedge Formation
4 Bottoms
Bearish MACD
Bearish Cross 50, 200 EMA
What other information do you need to know where we are headed in coming days? i see lots of big channels misleading members on price direction in coming days and i cant but pity those members who simply cannot keep things simple by simply looking at the chart.
If you are still here on this channel, i probabily know you have choosen to stay and learn the basics in order to be a better trader.......such value you definately will get here if you keep an open mind and follow our lessons.
Straight to the chart......
4 Hour— If you have been following our post here, you will remember we posted here few days ago that #BTC is on a bearish trend and that the next one month is going to be bloody as we may see a rest of previous lows.
I wasnt suprised when the whole market capitulated and was thrown into a pool of blood thus pushing BTC price to retest the $5800 (price touched $5879 before bouncing)
Right now the big picture is, price is rising as expected (to form the right shoulder of the head and shoulder pattern) on a very weak volume. This to me looks likes a "Break-Hook-And Go" to the down side if you pay attention to the current bearish head and shoulder pattern, bear flag, ABC correction wave, bear cross 50, 200 EMA on the 4 hour chart.
Lot of margin traders are being liquidated already within this bear flag as i can see lots of wicks within the flag. We will definately see a pull back at $6500-$6800 resistance area, and this will be the best point to enter short when the direction is clearer, as this pull back (as we are already seeing cos price just hit $6600 area as at the time of writting this report) may likely lead us to new lows if we break below the $6k-$5.8k support area
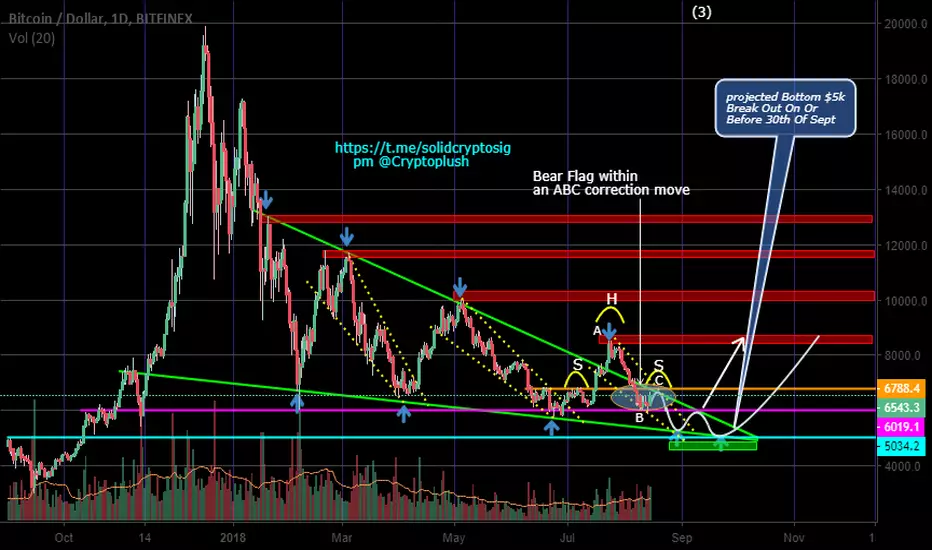
Daily— The daily seems to be giving us a clearer confirmation of price direction and timing.
Price has been respecting and trading within this pennant since since feb 6, with a possible break out at apex of the pennant on or before sept 30 2018.
Within this pennant we have had three successive wedge formation (3rd one ongoing), three major rallys after each break out, with four consecutive higher low tops and lower low bottoms. Most especially, price movement withing this wedge formation has been similar giving us a clue of what to expect during this final pull back IMO.
Price broke below the $6k psychological support area on the 3rd or 4th attempt or retest, the $5800-$5700 support area has been tested 3 times now and the bulls have successfully defended this area.
With the bearish head and shoulder pattern on the daily chart, and the ABC correcetion wave, and the fallen wedge formation, we may see a break below this area on the 4th attempt if the bulls give way, and this will lead us straight away to the $5400 support area before we see another bounce while $6k area will turn resistance by then.
Again remember, this is crypto, anything can happen.
Our analysis is simply based on the evidence and chart information steering at us now, and this new information on the chart is showing us a bearish trend.
As professional traders we must deal with the facts as they are, and respect what the market is telling us
The informations presented to us by the market clearly tells us the direction of #BTC price in coming days/weeks........the facts are there on the chart, we dont have to allow our rigidity to keep us down in a world of denial.......
Bear flag
Weak volume
Head and Shoulder Pattern
Fallen Wedge Formation
4 Bottoms
Bearish MACD
Bearish Cross 50, 200 EMA
What other information do you need to know where we are headed in coming days? i see lots of big channels misleading members on price direction in coming days and i cant but pity those members who simply cannot keep things simple by simply looking at the chart.
If you are still here on this channel, i probabily know you have choosen to stay and learn the basics in order to be a better trader.......such value you definately will get here if you keep an open mind and follow our lessons.
Straight to the chart......
4 Hour— If you have been following our post here, you will remember we posted here few days ago that #BTC is on a bearish trend and that the next one month is going to be bloody as we may see a rest of previous lows.
I wasnt suprised when the whole market capitulated and was thrown into a pool of blood thus pushing BTC price to retest the $5800 (price touched $5879 before bouncing)
Right now the big picture is, price is rising as expected (to form the right shoulder of the head and shoulder pattern) on a very weak volume. This to me looks likes a "Break-Hook-And Go" to the down side if you pay attention to the current bearish head and shoulder pattern, bear flag, ABC correction wave, bear cross 50, 200 EMA on the 4 hour chart.
Lot of margin traders are being liquidated already within this bear flag as i can see lots of wicks within the flag. We will definately see a pull back at $6500-$6800 resistance area, and this will be the best point to enter short when the direction is clearer, as this pull back (as we are already seeing cos price just hit $6600 area as at the time of writting this report) may likely lead us to new lows if we break below the $6k-$5.8k support area
Daily— The daily seems to be giving us a clearer confirmation of price direction and timing.
Price has been respecting and trading within this pennant since since feb 6, with a possible break out at apex of the pennant on or before sept 30 2018.
Within this pennant we have had three successive wedge formation (3rd one ongoing), three major rallys after each break out, with four consecutive higher low tops and lower low bottoms. Most especially, price movement withing this wedge formation has been similar giving us a clue of what to expect during this final pull back IMO.
Price broke below the $6k psychological support area on the 3rd or 4th attempt or retest, the $5800-$5700 support area has been tested 3 times now and the bulls have successfully defended this area.
With the bearish head and shoulder pattern on the daily chart, and the ABC correcetion wave, and the fallen wedge formation, we may see a break below this area on the 4th attempt if the bulls give way, and this will lead us straight away to the $5400 support area before we see another bounce while $6k area will turn resistance by then.
Again remember, this is crypto, anything can happen.
Our analysis is simply based on the evidence and chart information steering at us now, and this new information on the chart is showing us a bearish trend.
As professional traders we must deal with the facts as they are, and respect what the market is telling us
Related publications
Disclaimer
The information and publications are not meant to be, and do not constitute, financial, investment, trading, or other types of advice or recommendations supplied or endorsed by TradingView. Read more in the Terms of Use.
Related publications
Disclaimer
The information and publications are not meant to be, and do not constitute, financial, investment, trading, or other types of advice or recommendations supplied or endorsed by TradingView. Read more in the Terms of Use.