Looking at the chart you shared, it’s a Bitcoin (BTC/USD) 1-hour timeframe setup.
Here's the breakdown:
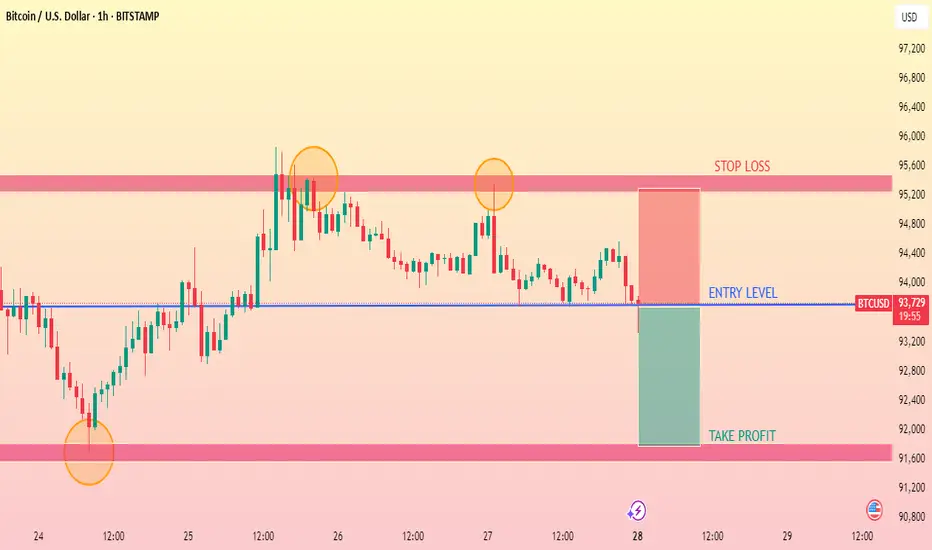
Entry Level is marked around $93,685.
Stop Loss is placed in the resistance zone around $95,200 - $95,600.
Take Profit is placed around $91,000 - $91,200.
You’ve highlighted previous important supply (resistance) and demand (support) zones with shaded pink/red areas.
Orange circles highlight price rejections from key levels (double/triple top pattern).
It looks like you're planning a short (sell) position, expecting the price to drop
Here's the breakdown:
Entry Level is marked around $93,685.
Stop Loss is placed in the resistance zone around $95,200 - $95,600.
Take Profit is placed around $91,000 - $91,200.
You’ve highlighted previous important supply (resistance) and demand (support) zones with shaded pink/red areas.
Orange circles highlight price rejections from key levels (double/triple top pattern).
It looks like you're planning a short (sell) position, expecting the price to drop
Trade active
TRADE ACTIVEDisclaimer
The information and publications are not meant to be, and do not constitute, financial, investment, trading, or other types of advice or recommendations supplied or endorsed by TradingView. Read more in the Terms of Use.
Disclaimer
The information and publications are not meant to be, and do not constitute, financial, investment, trading, or other types of advice or recommendations supplied or endorsed by TradingView. Read more in the Terms of Use.