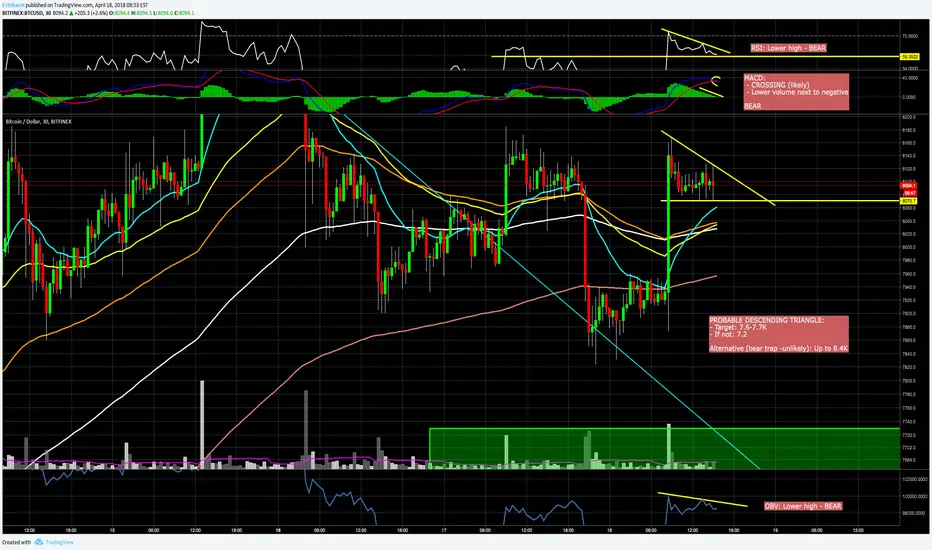
MACD, RSI, OBV and chart patterns indicate a high probability of breaking down to 7.6 area, look at the chart.
If bear trap, breaking up to 8.4, highly unlikely, but, do you know about TA, nobody is 100% certain.
------------------------------------------------------------------------------------------------------------------------------------------------------------------------------------------------------------------
MACD, RSI, OBV y el patron indica una alta probabilidad de ruptura inferior al área de 7.6K, mirad indicaciones en el gráfico.
Si es una trampa para bajistas, ruptura alcista a 8.4K, muy improbable, pero, ya sabéis sobre el análisis técnico, nada es al 100% de certeza
Related publications
Disclaimer
The information and publications are not meant to be, and do not constitute, financial, investment, trading, or other types of advice or recommendations supplied or endorsed by TradingView. Read more in the Terms of Use.
Related publications
Disclaimer
The information and publications are not meant to be, and do not constitute, financial, investment, trading, or other types of advice or recommendations supplied or endorsed by TradingView. Read more in the Terms of Use.