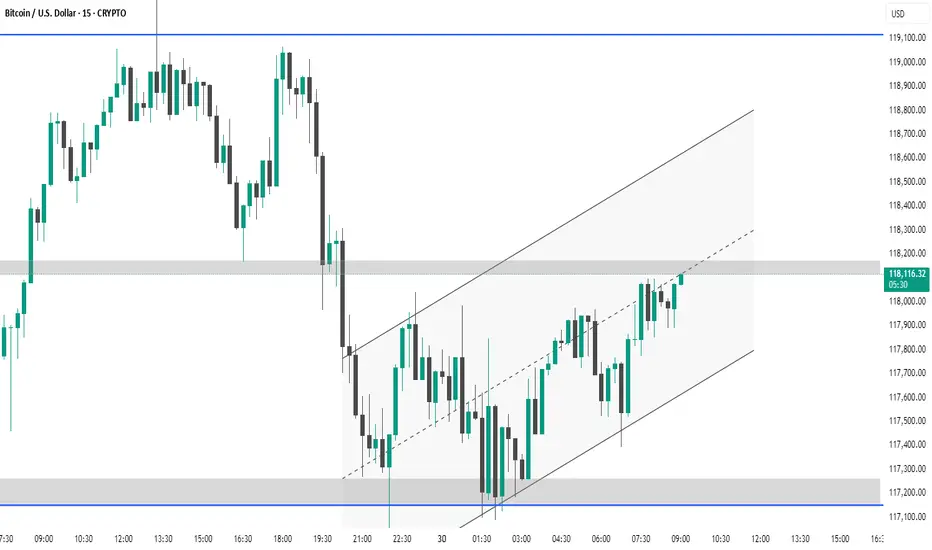
The chart shows Bitcoin (BTC/USD) on the 15-minute timeframe. Price is currently trading within an ascending channel after rebounding from a support zone around $117,200. It's approaching a key resistance area near $118,200, which aligns with the mid-channel line. A breakout above this resistance could signal bullish continuation, while rejection might lead to a retest of the lower trendline or support zone.
Related publications
Disclaimer
The information and publications are not meant to be, and do not constitute, financial, investment, trading, or other types of advice or recommendations supplied or endorsed by TradingView. Read more in the Terms of Use.
Related publications
Disclaimer
The information and publications are not meant to be, and do not constitute, financial, investment, trading, or other types of advice or recommendations supplied or endorsed by TradingView. Read more in the Terms of Use.